Keep Watch on Docker Hub Pulls with JFrog Log Analytics

By
5 min read

Have you heard? Docker Hub now limits usage by free anonymous and credentialed accounts. After the number of pulls from an IP address exceeds a fixed threshold within a six hour period (100 for anonymous, 200 for credentialed), Docker Hub throttles bandwidth. You’ll still get your Docker images, but at a much slower speed.
You can read our earlier blog post to learn more about the Docker Hub policy changes.
For organizations that rely on Docker Hub for their Docker registries, this new policy can mean a big hit to productivity. Since the threshold is per IP, rather than by user, those limits can hit an enterprise fast and frequently.
Do you know how these changes are affecting you? With the latest changes to JFrog log analytics, now JFrog Artifactory users can find out, and consider how to mitigate them.
Cache Docker Hub Pulls With Artifactory
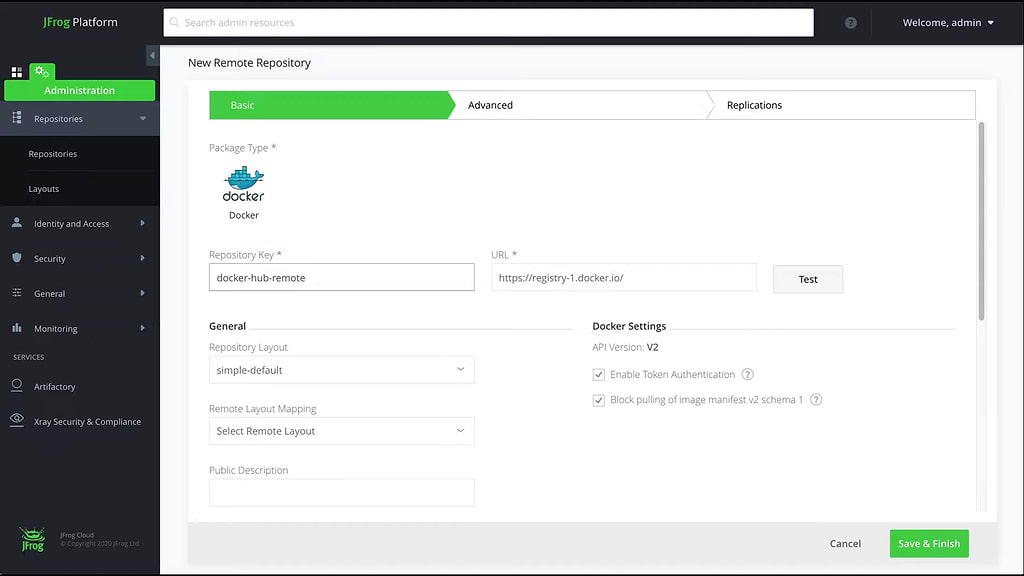
Users of Artifactory already have the means to attenuate their pull frequency, by establishing a remote repository for Docker Hub. This proxy repository will cache every Docker image pulled from Docker Hub, so that future pull requests for that image will be drawn from your artifacts repository manager.
In this way, only the first pull from Docker Hub into your cache will count against your Docker Hub pull limit. The Docker images you use most often will always transfer to your builds at full speed. And once cached, those images will always be available, even if Docker Hub isn’t.
You can also maintain your own secure private Docker registry in Artifactory, to further lessen your dependency on Docker Hub.
Docker Repository Analytics
For self-hosted installations of the JFrog DevOps Platform powered by Artifactory, we’ve made available a tool integration that provides unified JFrog log data through Fluentd data collection. We’ve also provided apps and integrations to consume this data and render dashboards for popular analytics programs that include Splunk, Elastic Stack, Prometheus/Grafana and DataDog.
Through the analytics tool that fits you best, you can view valuable operating statistics like data transfer volumes, what repositories are getting used by whom, and who’s being denied access.
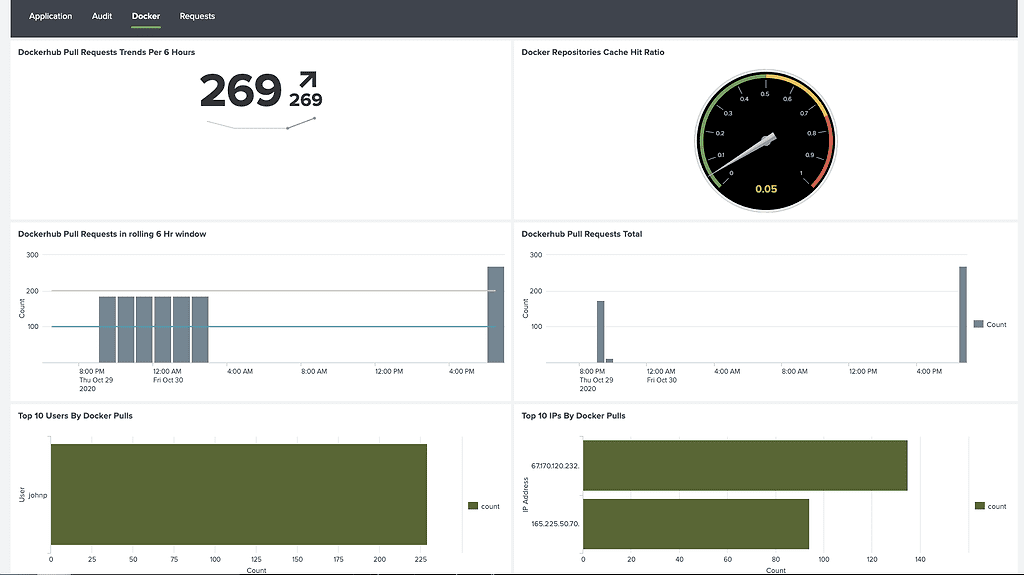
We’ve updated these integrations to provide a new tab of Docker statistics that will help you to monitor your usage of Docker Hub. Let’s take a look at them, and how they appear in the JFrog Logs app for Splunk.
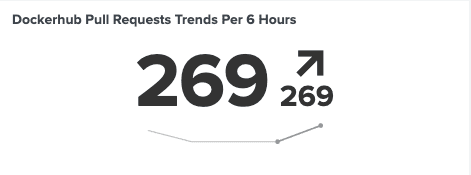
Pull Request Trend
A single count indicates the number of pull requests that were made to Docker Hub in the last 6 hours, and whether the trend is accelerating or declining. This count excludes those that were fulfilled by the remote repository cache (i.e., cache misses), so that it measures only the pull requests that count against the Docker Hub policy limit.
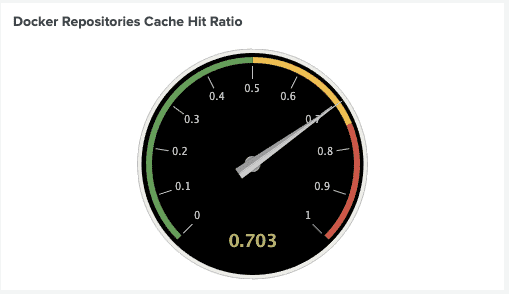
Docker Repositories Cache Hit Ratio
The frequency that Docker image pull requests are fulfilled by the cache is expressed as a ratio, where a value of 1 means the cache is fulfilling all requests. For example, the ratio shown below of 0.703 is a 70.3% cache hit rate. So, while cache misses totalled 269 (29.7%), 628 pull requests were served by Artifactory at full transmission speed.
Docker Hub Pull Requests
This graph shows the count of pull requests to Docker Hub within a rolling 6 hour window. Each bar shows the total number of pull requests made within the prior six hours from that hour mark.
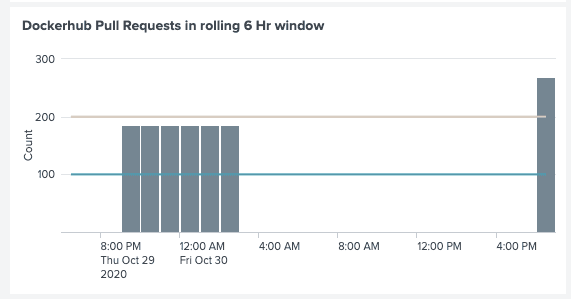
This statistic will help you to see whether your organization is nearing or exceeding the Docker Hub policy limits, and at what peak times.
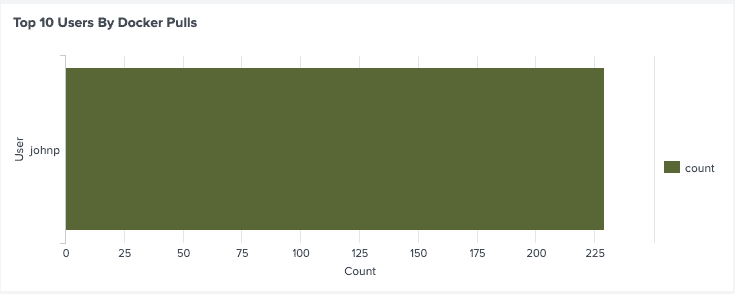
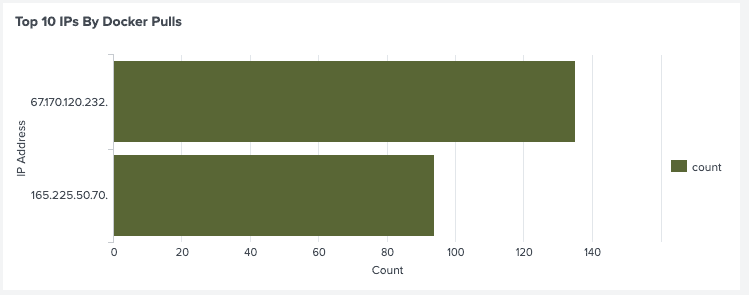
Top 10 Users and IPs
These statistics reveal who the dominant users of your Docker repositories are, by user and by IP address. If you find the pull requests being exceeded, this information can help you identify the chief parties responsible.
Getting Started
You can find the data collection and analytics tools in the Github repository for the JFrog log analytics integration.
It starts with an integration with the open-source data collector Fluentd that can be installed with each product instance of the JFrog Platform deployment. Fluentd performs the log input, field extraction, and record transformation for each product in the JFrog Platform, normalizing the output of this data to JSON for transfer to analytics and BI dashboards. You can learn about the details for each of the several analytics tools we support in one of our prior blog posts.
With this solution, you can manage the number and rate of pulls from Docker Hub, and mitigate against the new policy limits. We think you’ll be pleased to find how Artifactory helps you take control and steer your containers through these shoals.