
Stretch Your Reach with Unified JFrog Data and Elastic

DevOps teams rely on Artifactory as the bread and butter tool of universal binary repo managers, but observing its operations can be challenging. With multiple high availability nodes and unification with Xray as the JFrog DevOps Platform, that operations data is spread out across logs for each service in the JFrog Platform deployment.
Operations teams need a view into valuable data insights that can only be gained through real time data mining and observation of the platform. In our prior blog you may have seen the first taste of observability into unified JFrog logs using the Splunk analytics platform.
To make this observability more broadly available, JFrog has extended this capability to users of the Elastic Stack, with integrations for Elasticsearch and Kibana.
Elasticsearch is a distributed and scalable search engine that can be used for searching full-text, structured text and analytics. It is commonly used to search through large volumes of data and also to search through different kinds of documents.
Kibana is the most commonly deployed visualization and dashboard for Elasticsearch. Kibana enables you to explore Elasticsearch log data through a web UI of build visualizations and dashboards.
We’ll show you how to leverage best-of-breed open source log analytic technologies: Elastic, Fluentd, and Kibana to deliver a 100% free open source log analytic platform for operations teams to gain valuable insights.
Using Fluentd
To start, we’ve made available a JFrog log analytics integration with the open-source data collector Fluentd that can be installed with each product instance of the JFrog Platform deployment. Fluentd performs the log input, field extraction, and record transformation for each product in the JFrog Platform, normalizing the output of this data to JSON.
With all log data available in this common format, Fluentd will deliver it through Fluentd’s pluggable architecture to your Elasticsearch analytics tool.
Installing FluentD
Each JPD node needs a Fluentd logging agent installed. This agent will be responsible for tailing the various JPD log files for new log lines to parse into fields, apply any corresponding record transformations and then send to the relevant output plugin for Fluentd.
To install the Fluentd agent in each node, perform the procedure for the node’s OS type as shown in the Fluentd installation guide.
For example, for nodes operating Red Hat UBI Linux, the Fluentd agent td-agent must be installed. For root-based package managers (root access is required):
$ curl -L https://toolbelt.treasuredata.com/sh/install-redhat-td-agent3.sh | sh
Or, for user-space installations on Red Hat UBI, to install the Fluentd Ruby and Gem:
$ curl -O | tar -xvf
Configuring FluentD
Depending upon if we just completed a root based or non-root based installation the Fluentd configuration file may need to be placed in different locations.
By default for package manager root installations the td-agent.conf file is located in /etc/td-agent/.
$ ls -al /etc/td-agent/td-agent.conf
-rw-r--r-- 1 root root 8017 May 11 18:09 /etc/td-agent/td-agent.conf
For non-root based installations we can store the td-agent.conf file anywhere we have write permissions. When we run the td-agent, we can use the -c flag to point fluentd to this file location.
The configuration file must be replaced with a configuration file derived from the JFrog log analytics Github repo.
In this repo, the elastic folder contains configuration file templates. Use the template that matches the JFrog application running in the node:
We will need to update this configuration file with a match directive that specifies the host and port that points to our Elasticsearch instance:
#ELASTIC OUTPUT
  @type elasticsearch
  @id elasticsearch
  host elasticsearch
  port 9200
  index_name unified-artifactory
  include_tag_key true
  type_name fluentd
  logstash_format false
#END ELASTIC OUTPUT
The host here is our internal K8s cluster host elasticsearch because of the specification in the kibana_svc.yaml snippet we deployed. It can also be set to the external IP address if Elasticsearch and Kibana are configured in a different way.
Running Fluentd
Now that we have the new configuration file in place we can start the td-agent as a service on the pod after logging into the container:
$ systemctl start td-agent
For non-root installs, we can run the td-agent against the configuration file directly:
$ td-agent -c td-agent.conf
This will start the Fluentd logging agent which will tail the JPD logs and send them all over to Elasticsearch.
You must repeat these procedures for all Kubernetes pods running Artifactory and Xray.
Using Elasticsearch and Kibana
If you have yet to install and configure Elasticsearch and setup Kibana, do so now. We’ve also provided some helpful instruction and YAML files for deploying Elasticsearch and Kibana to Kubernetes.
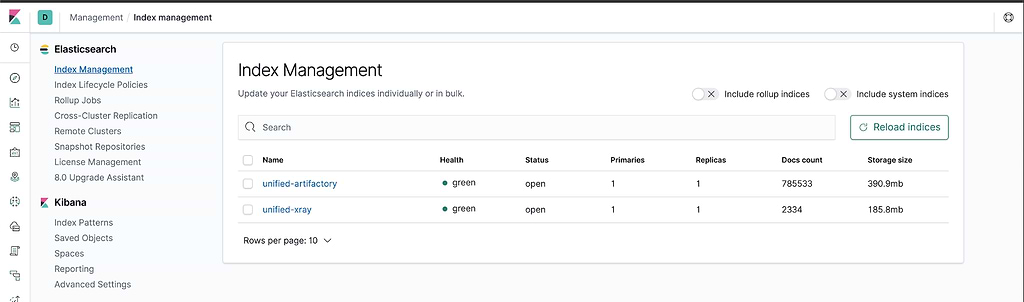
From Kibana, with Fluentd installed and the td-agent running in each Artifactory and Xray pod, you can see the index being generated in the Kibana Index Management page.
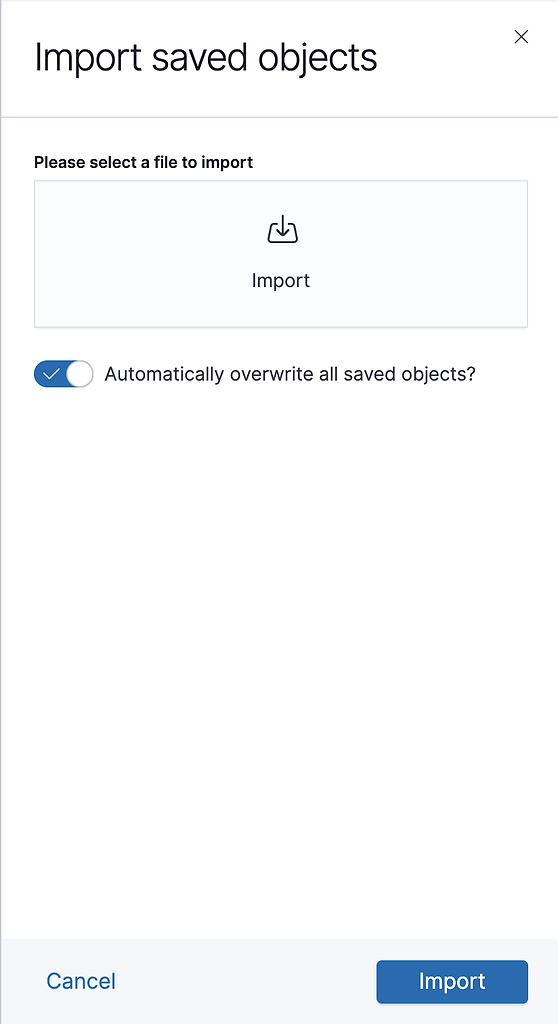
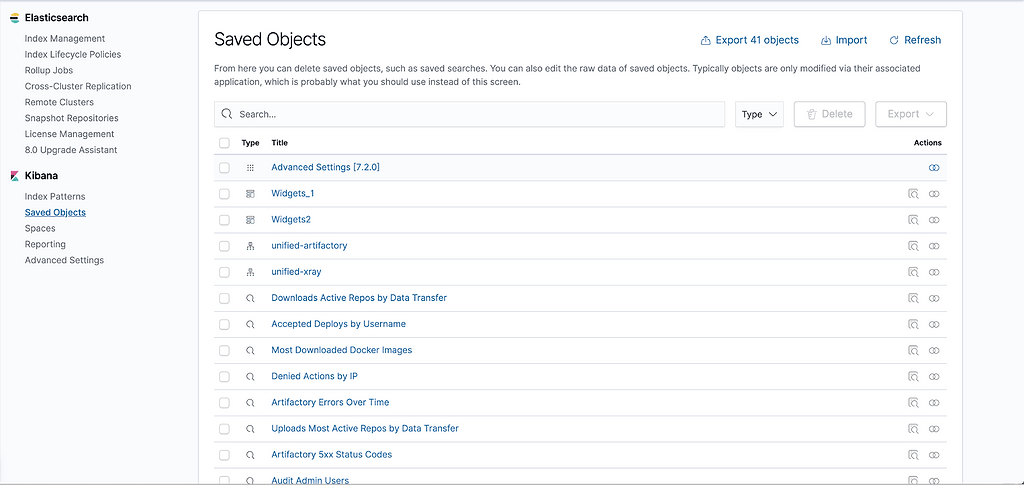
The JFrog integration for Elasticsearch/Kibana provides an NDJSON file that defines index patterns and visualizations. This file can be imported through the Kibana Saved Objects page.Click the Import button to import this file.
You should be able to see index patterns, visualizations, dashboards, widgets and saved searches being imported.
In the index patterns, you can see that we have 2 scripted fields for unified-artifactory pattern.
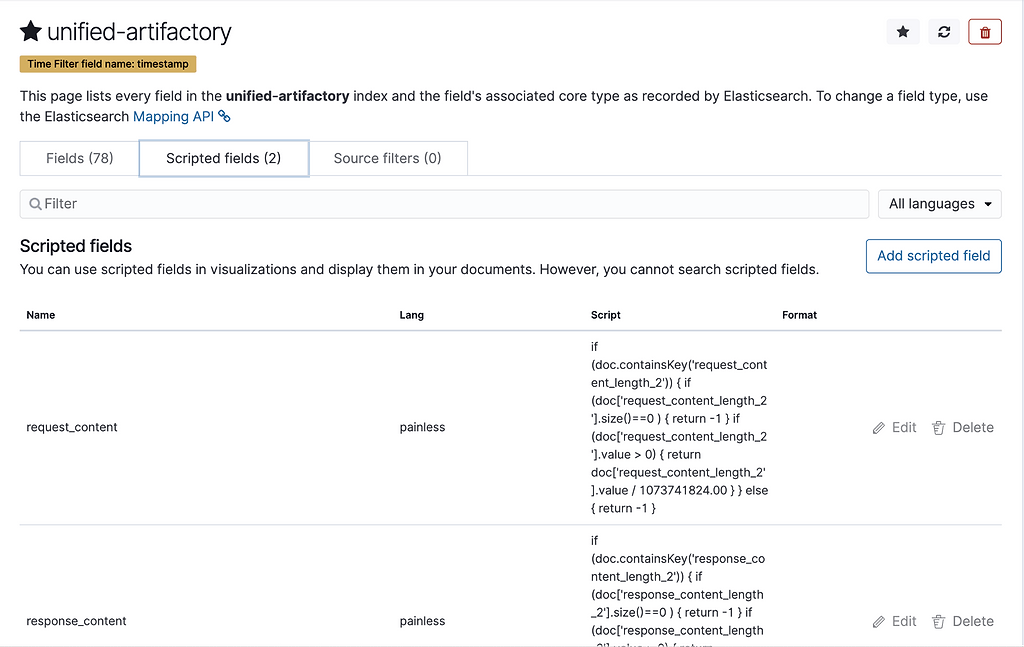
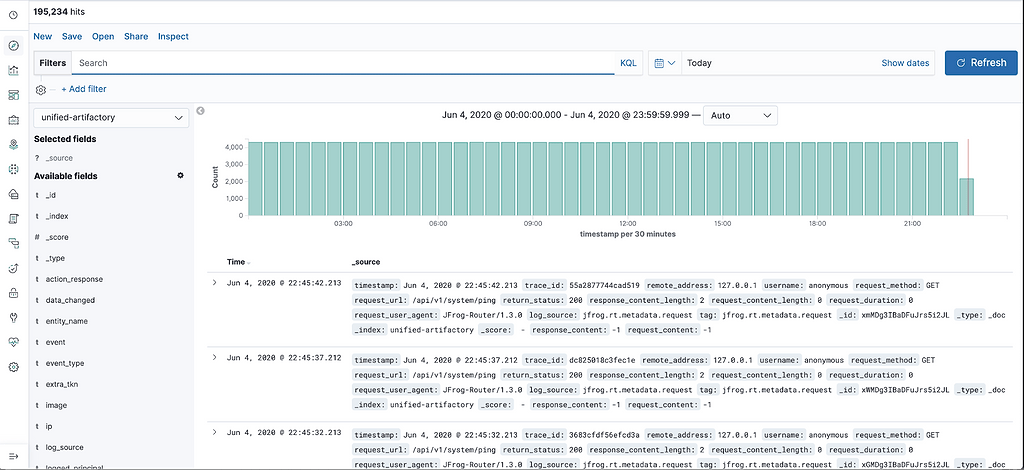
This is because we’re converting request_content_length and response_content_length to GB. You can look at the logs being generated in the Discover section.
Finally, let’s view the Dashboard which now contains information displayed throughout our data widgets to give you real time observability into the JFrog Unified Platform.
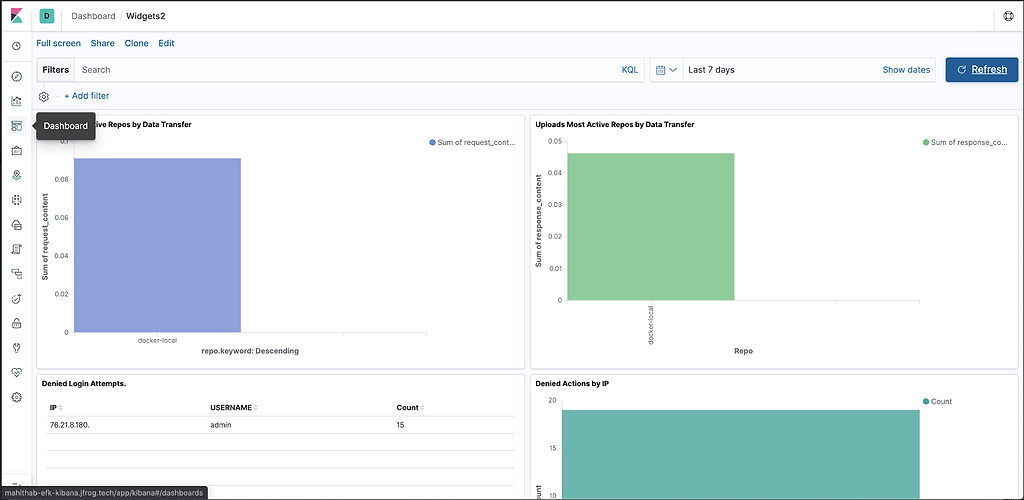
Once installed, The JFrog Logs dashboard presents timeline and count data for key operating metrics:
- Log volumes, which can be filtered by type
- Service errors
- HTTP response codes
- Accessed image
- Accessed repositories
- Data transfers in GB for uploads/downloads
- Top 10 IPs for upload/download
- Audit actions by username
- Denied actions and logins by IP and username
- Accepted deploys by username
When Great Things Come Together
Now you have a robust tool platform to monitor your JFrog Platform Deployment across all of its services and executing nodes, gaining valuable data insights into its operation.
Want to learn more about this and other best ways to use the JFrog Platform? Register for the virtual SwampUp 2020 conference, where you can participate in online training and in-depth sessions about Artifactory, Xray, Distribution, and Pipelines.
Experience
JFrog Today
Discover how the JFrog Platform unites DevOps, DevSecOps and MLOps for secure, rapid software delivery.