
Unified JFrog Log Analytics With Splunk

By
6 min read

We work best by coming together.
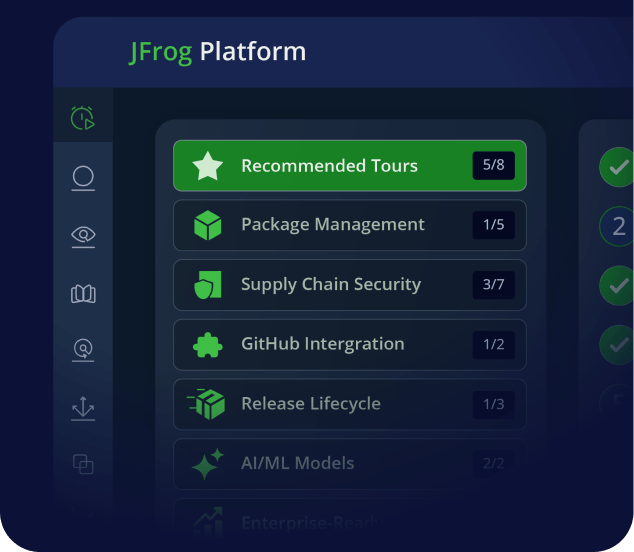
That’s why we built the JFrog DevOps Platform, bringing together our set of solutions to operate as a single, unified user experience. That unity powered by Artifactory 7 helps bring total understanding and control of your software build pipelines.
To keep it running, you also need a unified, real-time view of the entire platform’s operation. We now offer some tools that make that much easier to do, through the analytics and visualization tool you already use.
Let’s take a look at how you can install and use these new JFrog tools to monitor the operation of your JFrog Platform through Splunk.
Unified Logs for a Unified Platform
The JFrog Platform’s unity is powered by many microservices, each with its own log record. When spread across multiple nodes, as with a high-availability JFrog Platform deployment (JPD), the complete picture of your platform operation may be dispersed across 25 or more logs in your network.
Operations teams need a way to bring this JPD log data together into a single collection, to analyze performance and track down operating problems. And when even a small enterprise JPD might record millions of transaction events each day, operators need to be able to connect that data to a powerful analytics tool that can help find insights.
Preparing Splunk
To enable Splunk to receive the unified log data, you will need to set up the HTTP Event Collector (HEC) in your Splunk deployment. You can configure HEC in Splunk Enterprise.
Even if your Splunk deployment already has HEC enabled for other use, you will need to create an authentication token for exclusive use by the JFrog Platform.
You’ll need to note and have available these values from your HEC configuration:
- HEC Token – the GUID you create for authentication
- HEC Host – the Splunk instance that runs HEC
- HEC Port – the port number configured in HEC Global Settings
With this setup, your Splunk deployment is now ready to receive messages from the JFrog Platform.
Using Fluentd
To start, we’ve made available a JFrog log analytics integration with the open-source data collector Fluentd that can be installed with each product instance of the JFrog Platform deployment. Fluentd performs the log input, field extraction, and record transformation for each product in the JFrog Platform, normalizing the output of this data to JSON.
With all log data available in this common format, Fluentd will deliver it through Fluentd’s pluggable architecture to your analytics tool of choice..
Installing Fluentd
Each JPD node needs a Fluentd logging agent installed. This agent will be responsible for tailing the various JPD log files for new log lines to parse into fields, apply any corresponding record transformations and then send to the relevant output plugin for Fluentd.
To install the Fluentd agent in each node, perform the procedure for the node’s OS type as shown in the Fluentd installation guide.
For example, for nodes operating Red Hat UBI Linux, the Fluentd agent `td-agent` must be installed (root access is required for this OS):
$ curl -L https://toolbelt.treasuredata.com/sh/install-redhat-td-agent3.sh | sh
Once installed, `td-agent` can be found in the designated directory:
$ which td-agent
/usr/sbin/td-agent
You will also need to install on this node the Fluentd output plugin that fits your analytics tool. For Splunk, that will be the Fluentd plugin for Splunk Enterprise.
Configuring Fluentd
When the Fluentd agent was installed, it included a default configuration file.
$ ls -al /etc/td-agent/td-agent.conf
-rw-r--r-- 1 root root 8017 May 11 18:09 /etc/td-agent/td-agent.conf
This configuration file must be replaced with a configuration file derived from the JFrog log analytics Github repo.
In this repo, a fluentd folder contains configuration file templates. Use the template that matches the JFrog application running in the node::
For Splunk, once we have the template downloaded we will need to update the Fluentd config file with the Splunk HEC values in their placeholders:
...
#SPLUNK OUTPUT
  @type splunk_hec
  host HEC_HOST<
  port HEC_PORT
  token HEC_TOKEN
  format json
  # buffered output parameter
  flush_interval 10s
  # time format
  time_key time
  time_format %Y-%m-%dT%H:%M:%S.%LZ
  # ssl parameter
  use_ssl true
  ca_file /path/to/ca.pem
  @type splunk_hec
  host HEC_HOST
  port HEC_PORT
  token HEC_TOKEN
  format json
  # buffered output parameter
  flush_interval 10s
  # time format
  time_key timestamp
  time_format %Y-%m-%dT%H:%M:%S.%LZ
  # ssl parameter
  use_ssl true
  ca_file /path/to/ca.pem
#END SPLUNK OUTPUT
Running Fluentd
Now that we have the new configuration file in place we can start the td-agent as a service on our system:
$ systemctl start td-agent
Alternatively we can run td-agent against the configuration file directly:
$ td-agent -c td-agent.conf
This will start the Fluentd logging agent which will tail the JPD logs and send them all over to Splunk.
Using Splunk
Once the aggregated log data is available through Fluentd, you can use Splunk to search, analyze and visualize the data.
The JFrog Logs app for Splunk available in Splunkbase must be downloaded and installed to connect your JFrog Platform log data to your Splunk account.
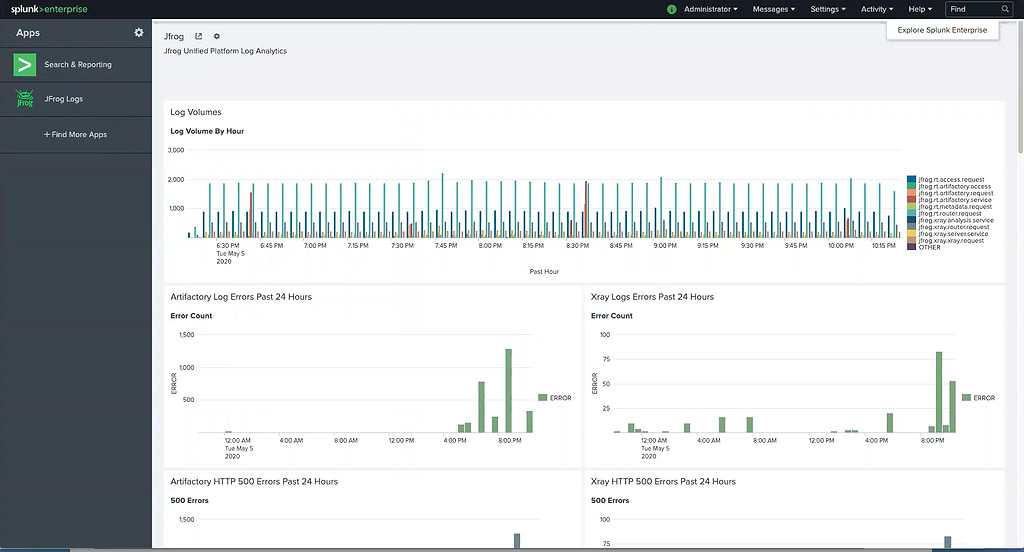
Once installed, The JFrog Logs dashboard presents timeline and count data for key operating metrics:
- Log volumes, which can be filtered by type
- Service errors
- HTTP response codes
- Accessed image
- Accessed repositories
- Data transfers in GB for uploads/downloads
- Top 10 IPs for upload/download
- Audit actions by username
- Denied actions and logins by IP and username
- Accepted deploys by username
If you need more, you can use the unified data to build your own custom dashboard widgets in Splunk, to gain the operating insights you need.
Coming Together
With our new log analytics installation, it’s now much easier to monitor your JFrog Platform deployment across all of its services and executing nodes.
Be aware that the full solution only works with Artifactory 7 and other components of the JFrog Platform. So if you’ve been meaning to upgrade from Artifactory 6, add this convenience to your list of reasons to get it done.
This usage with Splunk is the first analytics tool integration we’ve made available. But we’ll be offering ones for other popular analytics and data visualization solutions soon, so you can leverage the tools you prefer.
Experience
JFrog Today
Discover how the JFrog Platform unites DevOps, DevSecOps and MLOps for secure, rapid software delivery.