
Unified JFrog Platform Monitoring With Prometheus and Grafana

Running the JFrog DevOps Platform on Kubernetes in your enterprise can mean serving millions of artifacts to developers and customers each day. But operating at top performance requires being able to answer some vital questions. Like what is the most requested artifact? What is the most popular repo? Who are your heaviest users? For security, which users are doing bad things, and from which IPs?
To help you learn those answers, a set of integrations now available from JFrog can provide log analytics for monitoring your JFrog Platform’s activity, delivering important feedback that can help improve your development strategies.
Operating on K8s, you may already be using Prometheus, the de facto Kubernetes monitoring solution since emerging from the Cloud Native Computing Foundation (CNCF) in 2018. Used with visualization tool Grafana,they can provide a central dashboard for performance analytics on applications and the K8s cluster itself.
To enhance your Prometheus-based monitoring, we’ve made available a JFrog log analytics solution for Prometheus and Grafana. This integration enables collection of JFrog Platform log data and examining operational metrics to gain vital insights with the monitoring tool you already use.
If Prometheus isn’t your monitoring tool choice, we’ve also provided solutions for use with Splunk, Elastic, and DataDog.
Installing FluentD
The linchpin of our monitoring and logging initiative is FluentD, the open-source logs collector. With FluentD, we are able to provide a common logging and monitoring layer for all of our JFrog services. FluentD can quickly be installed on many platforms. See the installation guide for your platform.
For our JFrog servers, we use the RedHat installation instructions to install the FluentD td-agent:
$ curl -L https://toolbelt.treasuredata.com/sh/install-redhat-td-agent3.sh | sh
Additionally, we need to install the Prometheus FluentD plugin which exposes our logging events as an HTTP metrics interface for Prometheus. We’ll get to that in a moment.
Configuring FluentD
FluentD is configured with a text configuration file which contains chains of input sources, filters and outputs. The Prometheus FluentD plugin provides syntax for configuring metrics for Prometheus. In our case, we convert Artifactory and Xray log events into metrics for Prometheus. We have already set up example Artifactory and Xray FluentD configurations here.
Choose the appropriate fluent.conf.* file and start td-agent.
- fluent.conf.rt – Artifactory version 7 server
- fluent.conf.rt6 – Artifactory version 6 server
- fluent.conf.xray – Xray server
$ td-agent -c fluentd.config.rt
td-agent then exposes a HTTP metrics interface on port 24321 /metrics. You can go to that URL and see something like the following.
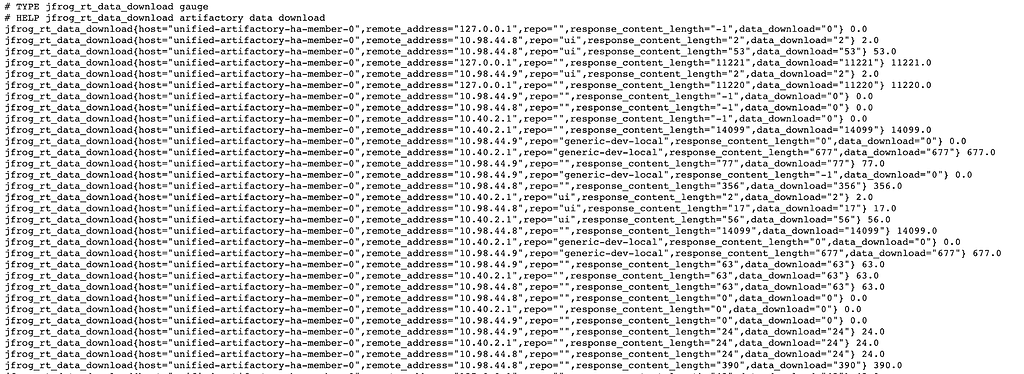
Prometheus will then “scrape” this interface periodically and add these metrics to its time-based datastore.
Prometheus
For our environment, we installed Prometheus using the Prometheus Kubernetes Operator. If you don’t already have Prometheus installed, instructions for how to install the Prometheus using the operator are here. Using the Prometheus Kubernetes Operator allows us to configure ServiceMonitors which allows Prometheus to automatically detect new metrics interfaces for our services. Otherwise, a YAML configuration file can be used as described in the Prometheus documentation. The following ServiceMonitor resource configuration can detect any new metrics interfaces using the Kubernetes selector.
apiVersion: monitoring.coreos.com/v1
kind: ServiceMonitor
metadata:
 name: servicemonitor-artifactory-ha-primary
 labels:
   metrics: jfrog
spec:
 selector:
   matchLabels:
     app: artifactory-ha-primary
 endpoints:
 - port: metrics
   interval: 15s
This selector will match our metrics interface services with the label app: artifactory-ha like the following metrics interface service. This service exposes the HTTP metrics interface that we set up with our FluentD Prometheus plugin above.
apiVersion: v1
kind: Service
metadata:
 labels:
   app: artifactory-ha-member
 name: artifactory-member-ha-metrics
spec:
 ports:
 - name: metrics
   port: 24231
   protocol: TCP
 selector:
   role : unified-artifactory-ha-member
We can further verify the automatic detection of our metric interface services in our Prometheus Target list.
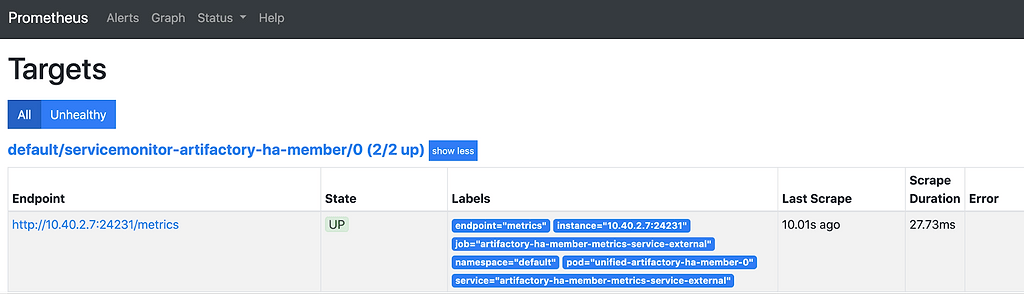
This makes Prometheus configuration quick and easy especially for large scale systems that may have hundreds of servers.
Grafana
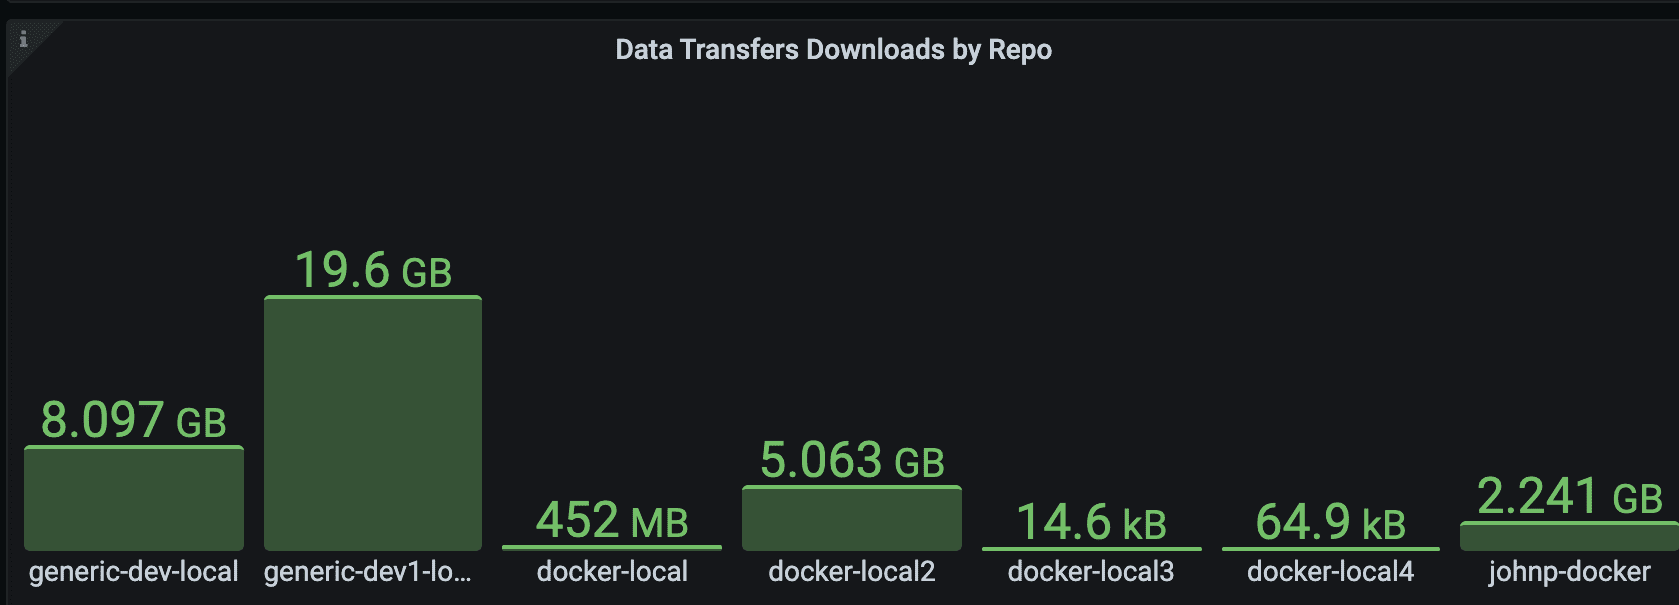
With Prometheus now collecting our metrics, we can now visualize them with Grafana, the visualization layer for Prometheus. Using Prometheus’s PromQL query language, we can set up queries for our dashboard. For example, the following PromQL provides the top data transfers by repos.
topk(10, sum by (repo) (increase(jfrog_rt_data_download{repo!=""}[$__range])) > 0)
And can give us the following bar gauge widget.
Our FluentD configuration provides several Artifactory and Xray monitoring metrics that you can query and create your own dashboard widgets. A great starting point is to use our example dashboards. This example dashboard provides the following graph widgets.
- Upload Data Transfers
- Download Data Transfers
- Top Downloading IPs
- Top Uploading IPs
- Top Artifacts by Requests
- Top Repos by Requests
- Top Repos by Data
- Audit Users
- Artifactory User Access
- Artifactory 5XX Status Codes
- Artifactory Errors
- Xray 5XX Status Codes
- Xray Errors
- Denied Login Attempts
- Denied Actions by IP
- Denied Actions by User
Import this dashboard into Grafana to see all the metrics in use.
Look and Learn
For more in-depth details, check out the JFrog Log Analytics for Prometheus and Grafana GitHub.
If you are a data-driven organization and using the JFrog Platform, you may be missing out on an incredible source of data into how your customers and developers are using your binaries, Docker images, Helm charts, Go modules, Maven and more. Start monitoring today. You might be surprised with what you learn!
Experience
JFrog Today
Discover how the JFrog Platform unites DevOps, DevSecOps and MLOps for secure, rapid software delivery.