Best Practice Guide – Data Monitor
This guide goes over the best practice to monitor your device software application and any other data value using JFrog Connect platform. The best practice guidelines are thought about how to set Data Monitor parameters, send parameters value from the edge device to the platform, and set dedicated logic alerts.
Data Monitor approach
JFrog Connect provides an easy-to-use way to monitor each and every device important data while receiving platform and email alerts in accordance. This method can help you monitor your product application as well as learning your device’s behavior by watching and monitoring the received value of each parameter.
Guidelines
There are 3 main things we need to set up with the Data Monitor tool to get the best from our devices.
Dashboard – Configure Data Monitor parameters
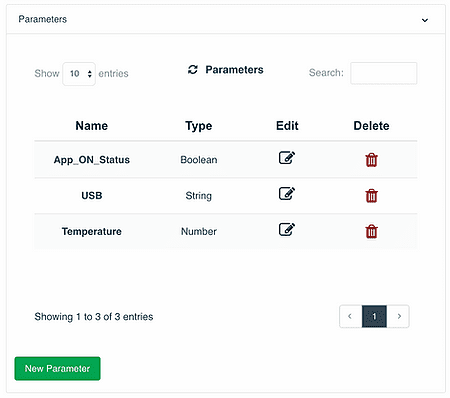
1. Under the Data Monitor category, click on the ‘New Parameter’ green button.
2. Enter the parameter name and the value type you would like to send – string, number (integer), or boolean.
3. Save the parameter and make sure you can see it under the Parameters section.

Device Side – Send parameters value
1. On the device side, we need to create a script that is responsible for sending the parameter value. To do so, each request has to include the device token and the user token (both can be found under /etc/upswift/settings.json), for more information check the Data Monitor section in JFrog Connect docs.
2. Here is a quick python script that pulls the JFrog Connect tokens and makes a Data Monitor request with 1 APP Monitor parameter – USB:
import json
import requests
UPSWIFT_SETTINGS_FILE = ‘/etc/upswift/service/settings.json’
#Pull JFrog Connect tokens
with open(UPSWIFT_SETTINGS_FILE) as json_file:
data = json.load(json_file)
#JFrog Connect tokens
user_token = data[‘user_token’]
device_token = data[‘device_token’]
#Value of the USB parameter
number_of_connected_usb = 2
#Build a request including the App parameter and the parameter value
json_content = {‘device_token’: device_token,
‘user_token’: user_token,
‘app_parameters’: [{‘app_parameter_name’: ‘USB’, ‘app_parameter_value’: number_of_connected_usb}]}
#Send a request to JFrog Connect servers
call_request = requests.post(“https://api.upswift.io/v1/send_app_monitor”,json=json_content)
call_response = json.loads(call_request.text)
if call_request.status_code != 200:
if call_request.status_code == 429:
error = “API limit reached”
else:
error = call_response[“error_message”]
print(error)
*This script can be written in any other language with HTTP request capability.
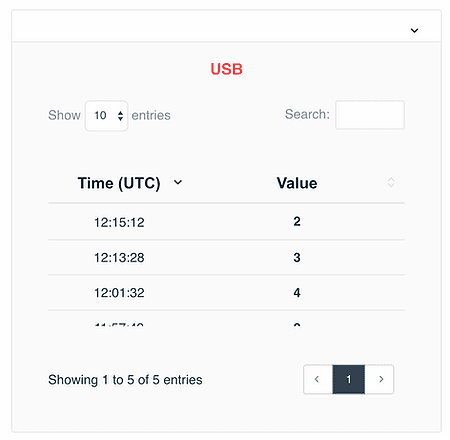
By running this script, the device will send the parameter ‘USB’ with the value ‘2’ to JFrog Connect server, Data Monitor tool.
In a few seconds, you will be able to view the sent value in JFrog Connect Data Monitor ‘Stats’ section:

Dashboard – Set Data Monitor alerts logics
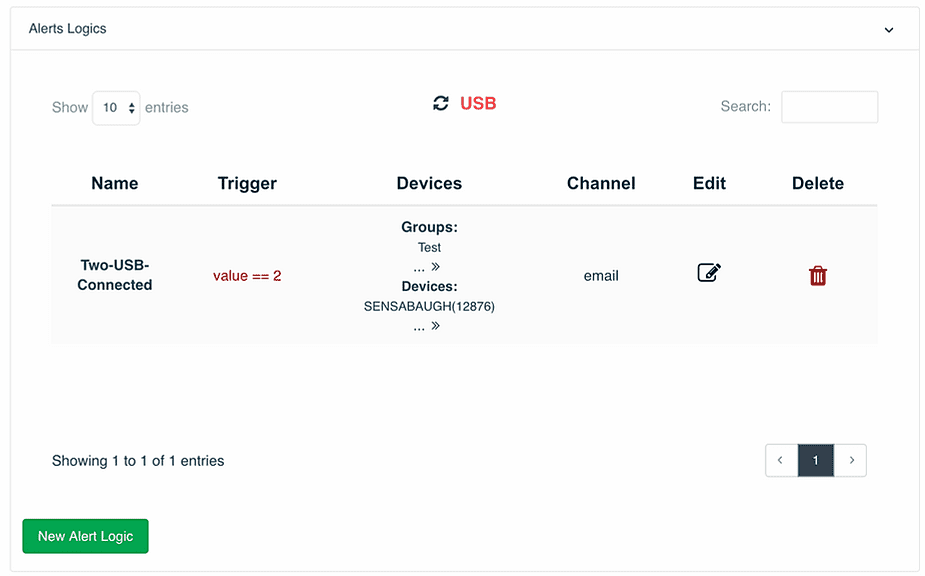
1. The final step here is to set an alert logic on one of our Data Monitor parameters. Using alerts logics you can receive an alert based on the parameter value changes.
2. Click on your parameter, and under the Alerts Logics section, click on the ‘New Alert Logics’ green button to add a new alert logic system, fill in the rules as needed.

3. After saving the new logic, you will be able to start receiving alerts based on the specific parameter values and their logics.


