
Part I: A Journey Into the World of Advanced Security Monitoring

By
7 min read

Dealing with hundreds of security alerts on a daily basis is a challenge. Especially when many are false positives that waste our time and all take up too much of our valuable time to sift through. Let me tell you how our security team fixed this, as we built security around the JFrog products.
First, let me tell you a little bit about our team.
Security Engineering at JFrog
JFrog Security – CSO Office is focused on protecting our customer data, ensuring the security of our cloud infrastructure, providing the highest product & application security standards and responding to emerging security threats. Learn more about Security at JFrog >
Performance, scalability, ease of use and flexibility
As part of our efforts to enhance our processes and better suit our continuously growing needs, we decided to build our security monitoring system from scratch, and make it top-notch. After researching the different approaches, we decided to create a solution that some may say is unconventional, including the following two main parts:
- Containerizing our log shipping components
- Using a messaging queue
The purpose of this blog post is to share how we tackle, on a high level, the major pain points which every security engineer/architect that ever worked with traditional security monitoring systems felt.
So, who is this blog post for?
- If you’re about to decide what the architecture of your security monitoring system/solution should be – this is for you.
- If you’re tired of chasing health issues in your log collectors, peaks of data that causes indexing issues or simply melting down your DB with too many requests – this is for you.
This blog post will describe the reasons why we decided on these solutions and our final architecture today. Hopefully sharing our use case can provide additional guidance for you and your organization. This will be the first part of three blog posts, including: Security monitoring (aka SIEM), Automation (aka SOAR) and Bots (aka Chat bots).
Let’s get started with our key takeaways and recommendations for the solutions we chose.
Note: our team chose to tackle all of the issues and start fresh. However, you may choose to tackle only some parts of your existing security monitoring, such as the technology, alerting channels, or processing.
1. Containerizing log shipping components
In most traditional security monitoring systems, the log shipper can be your biggest fail point. This is because keeping it running can be a very challenging task, especially in a complex architecture where you’ll find dozens or hundreds of different services. Using a containerized version of a log shipper can help a lot.

The benefits:
- Saves tons of compute resources without many instances to run services.
- Much more resilient with the ability to set a restart policy in case the “service” dies.
- No-hassle recovery without a need to rebuild your service if it fails or is corrupted.
- Adds a layer of security as services are isolated, allowing credentials and other secrets to be separated.
2. Using a messaging queue (MQ)
Next, we chose to use a buffer (aka queuing system). In our case we chose to use Kafka.
The benefits:
- Absorbs the peaks and overloads – Every now and then you’ll receive a big chuck of logs that you definitely did not expect or prepare for from a sizing perspective. A messaging queue can save you from losing data, corruption and service down sort of trouble.
- Backups – Though it’s not a backup system, you should backup your data using snapshots, buckets, etc. Using a messaging queue can help with momentary changes. Upgrading a version and need to stop your SIEM for an hour? No problem! Did some config change in one of your nodes? Bring it on!
- Load balancing – Not all log ingestion solutions know how to load balance the traffic and MQ can help with that by allowing the consumers to split the load evenly.
Example of a simple architecture:

(Source: “Just Enough Kafka for the Elastic Stack” elastic.co)
On the left we can see our log shippers (e.g. DB, Filebeat, Syslog, etc) sending data to Logstash (which can also be sent directly to an MQ if it’s supported by the log shipper), which is then sent to a messaging queue (Kafka). Then a consumer fetches the data from the MQ that sends it to a SIEM (ELK Stack).
Each environment has its own requirements. Here are some available guides that go into detail of how to size the different components:
- Elasticsearch – Sizing and Capacity Planning
- Elasticsearch – Service pricing calculator
- Benchmarking and sizing your Elasticsearch cluster for logs and metrics
- Elasticsearch guide – Tune for indexing speed
- Elasticsearch guide – Tune for search speed
- Elasticsearch calculator
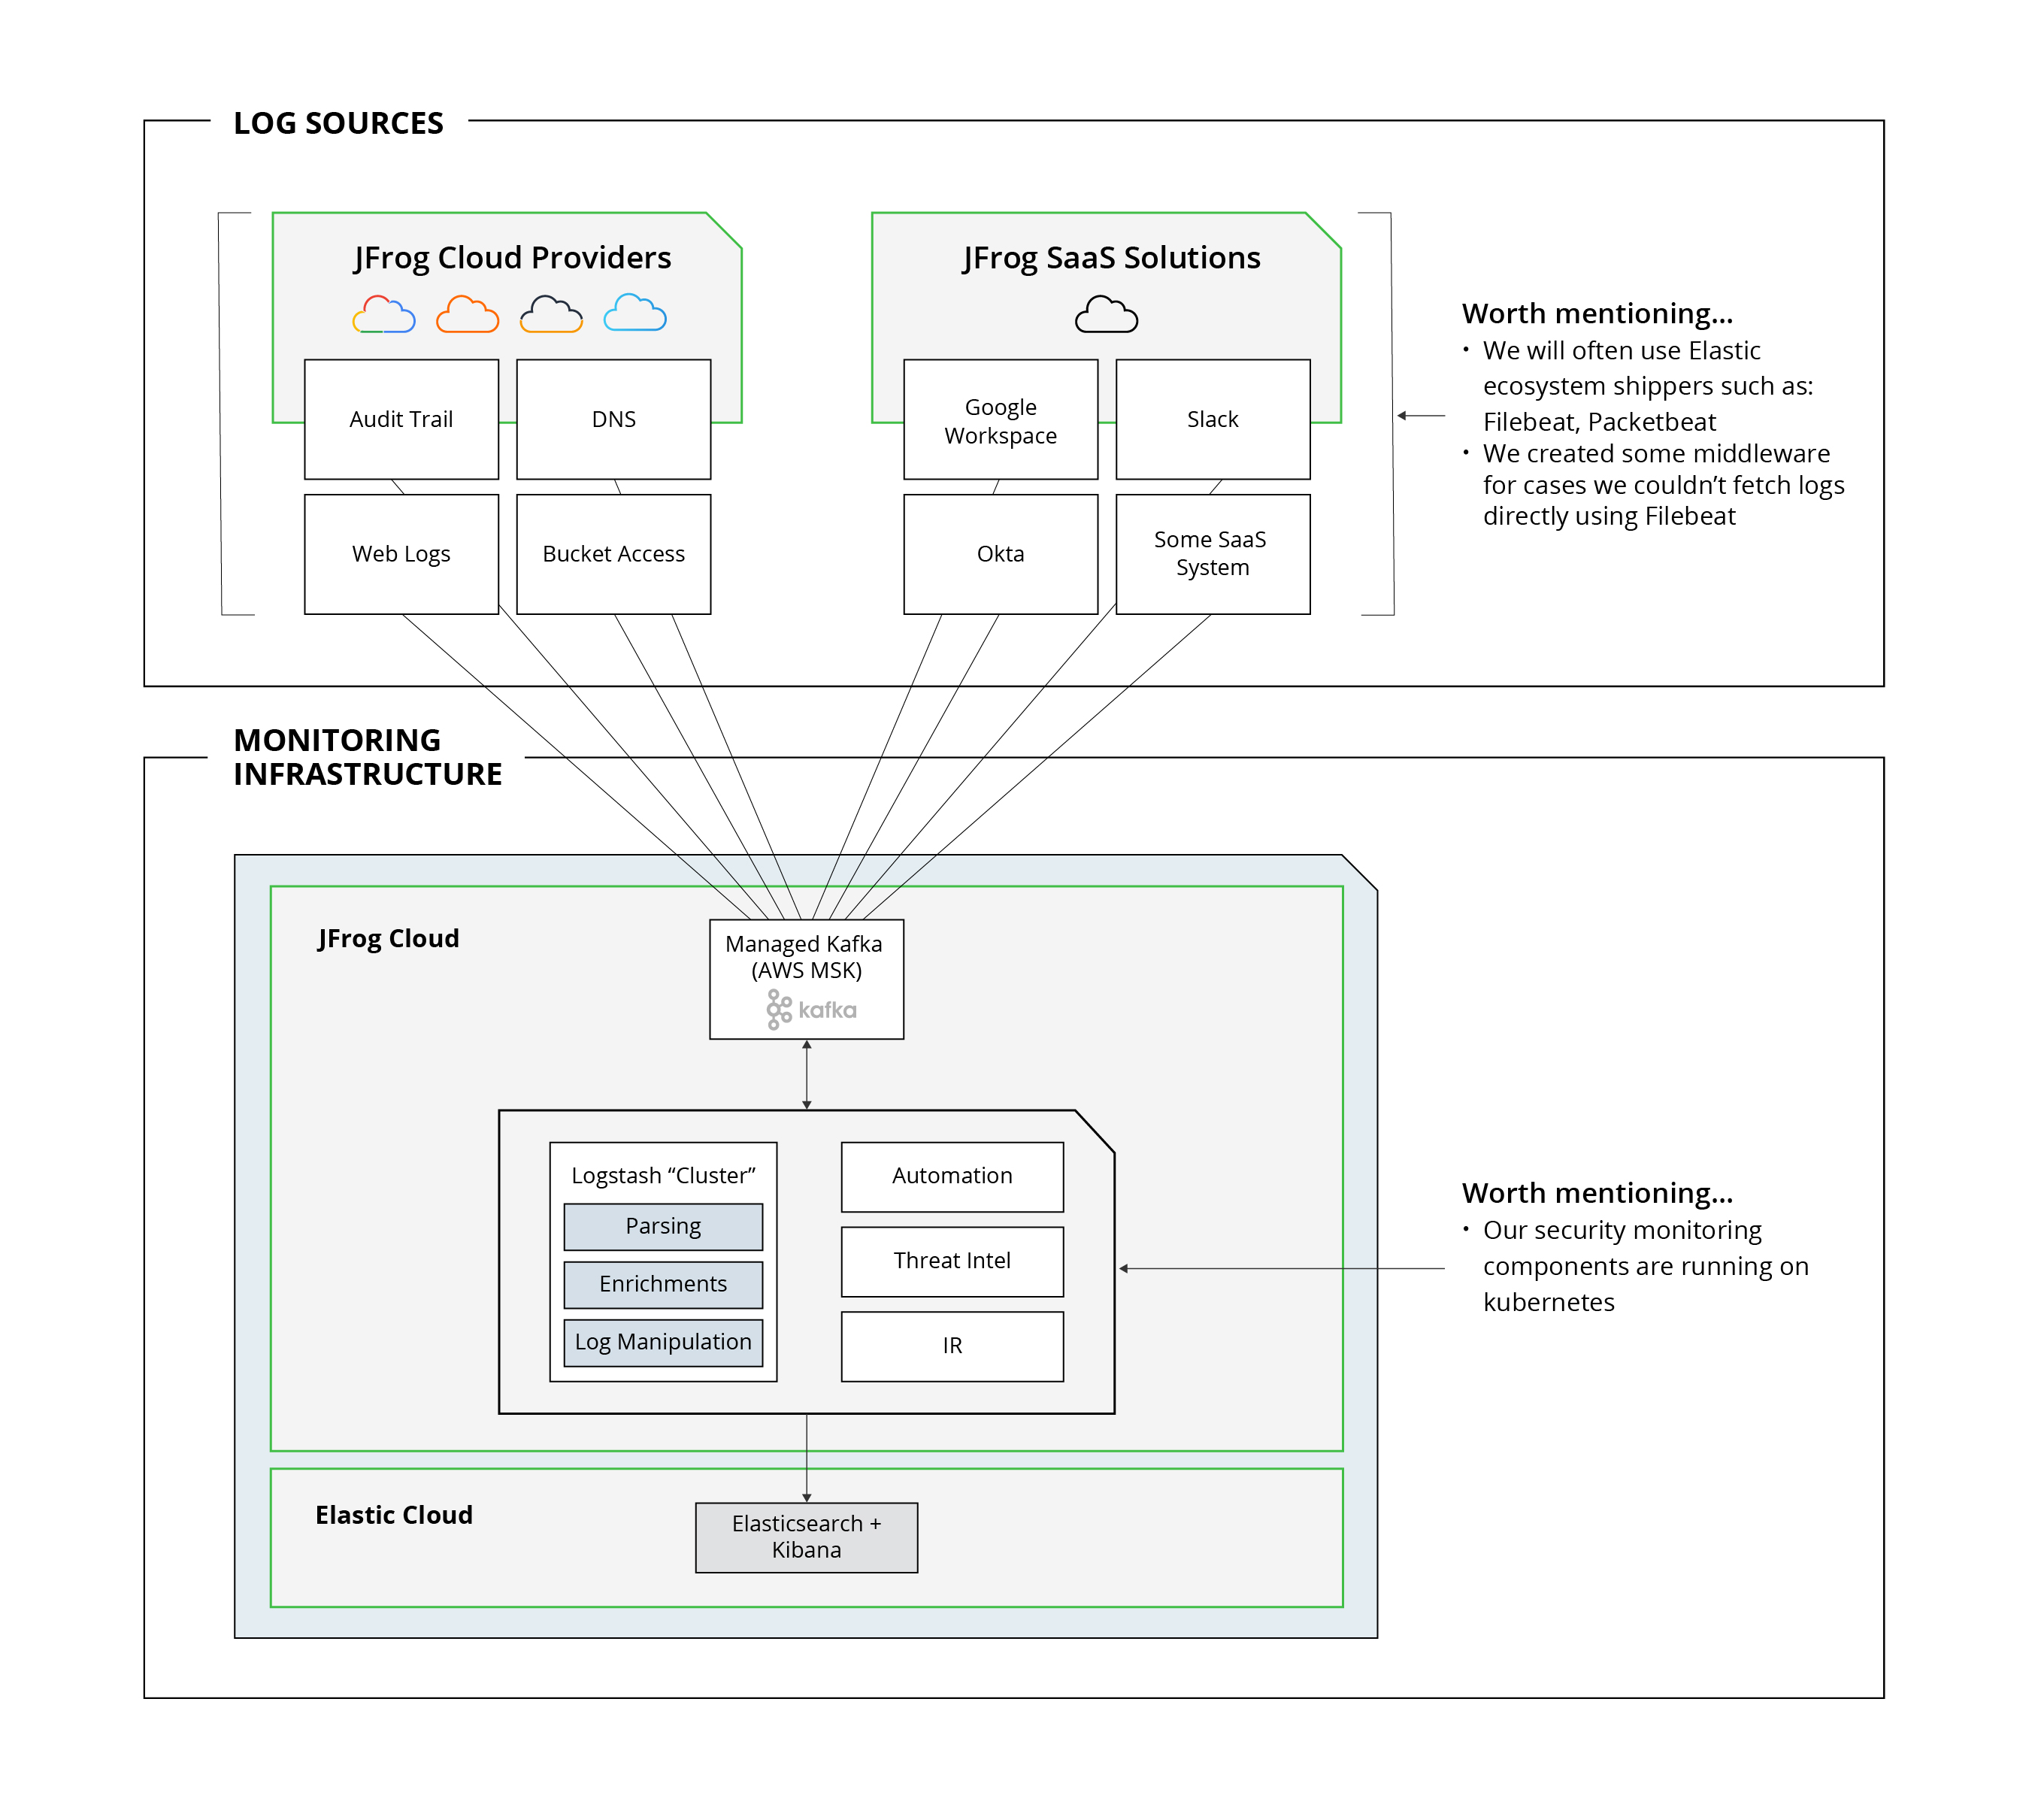
Final architecture and infrastructure
Here are the main components and motives for our final architecture:
Log Sources/Shippers
- Elastic components make it possible to avoid compatibility issues. It’s easier to maintain a smaller number of component types. For example, upgrading all shippers only requires changing the Docker image version.
- Smaller number of branches (as much as possible) keep things simple and help us save time on maintaining our infrastructure.
Messaging Queue (aka Kafka, as discussed above)
- AWS manages the infrastructure and provides us with a managed service.
- We only manage the application side of things (topics, replications, retention, monitoring).
Logstash “Cluster”
- Since Logstash can’t really run as an HA/Cluster, it isn’t exactly considered a cluster. But, having it perform as a consumer to Kafka basically means that working with a queue will allow balancing the load, resulting in more partitions in a Kafka topic. Consuming it with an equivalent number of threads allows us to read the information faster in a balanced way and avoid any peaks which are not a favorite of either Logstash or Elasticsearch.
- Having Logstash to consolidate logs to a single pipeline allow easier control for: logs manipulating, tagging, enrichment (e.g. Maxmind Geo information) or even matching your favorite firewall logs with OSINT from MISP (resource: https://owentl.medium.com/enriching-elk-with-threat-intelligence-4813d3addf78)
Elasticsearch/Kibana
- There are many great online tutorials to get started with Kibana, such as the Elastic stack (ELK) on Docker.
A few more additional takeaways:
- Outsourcing to a managed service/SaaS can free up your business to focus on its strengths, allowing your team to concentrate on their main tasks and future strategy.
- The security monitoring infrastructure is critical. We all want to prevent service outages. SaaS can help, especially if your team is small or even doesn’t exist yet.
Conclusion
To sum up, here’s a recap of what we achieved:
- Increased capacity – We gained infrastructure stability and resiliency, easier deployment process, untangled troubleshooting process. Less people needed to steer the ship = more time to do IR. (The next piece of the puzzle, which is automation, will be covered in the next post)
- Improved time investment per engineer – Having a reliable monitoring solution means spending less time investigating. Eliminating issues such as missing logs, parsing problems, and lack of data can really make a big impact on time efficiency.
- Fine tuning – As a SIEM engineer, this is the first time I can say that I no longer have to live in the fear of a service outage. Running our infrastructure on a relatively stable solution (e.g. Kubernetes, Docker) allows us to self-heal different components from faults that used to break the logging pipeline.
Hopefully our journey will help other teams rethink their security logging infrastructure.
Reach out, ask questions, share your thoughts, concerns and ideas over LinkedIn.
Last but not least, we’re hiring! Check out the open positions >
Experience
JFrog Today
Discover how the JFrog Platform unites DevOps, DevSecOps and MLOps for secure, rapid software delivery.