Improve Cloud Visibility with JFrog’s SaaS Log Streamer
Get your JFrog SaaS logs delivered natively and directly to leading cloud Application Performance Monitoring (APM) tools such as Datadog or Splunk.
Updated November 27, 2024: JFrog’s SaaS Log Streamer now supports log streaming to Datadog, Dataset, Dynatrace, Elastic, Grafana Loki, New Relic, and Splunk. This log streaming service is available to customers on JFrog Cloud Enterprise+ subscriptions.
The beauty of deploying SaaS-based applications is that you don’t have to worry about building the infrastructure, hiring engineers to maintain it, staying on top of upgrades or worry about application security. Indeed, these are some of the main benefits you get by using a SaaS offering. However, the world of software is full of trade-offs, so, what do you lose out on?
One of the drawbacks of going the SaaS route, typically means that application logs are not readily available, making visibility into application metrics extremely difficult, if not impossible. All those logs that you relied upon when running applications in your own infrastructure are no longer accessible when using a SaaS offering.
Being in the dark about the applications you rely on is less than ideal, as you need certain information from the logs that are critical to your business. So how do you reap all the benefits of SaaS while maintaining access to important data from your core applications?
That’s where JFrog’s SaaS Log Streamer comes to the rescue, giving you the best of both worlds – maintenance free infrastructure along with great visibility into your applications. On top of that, you minimize the noise and increase efficiency by cutting out all the irrelevant logs to concentrate on what really matters.
JFrog Saas Log Streamer is now available for JFrog customers.
Get Started*
*Reference JFrog’s SaaS Log Streamer in the Requested Technology Integration field
*Available for JFrog Cloud Enterprise+ subscriptions
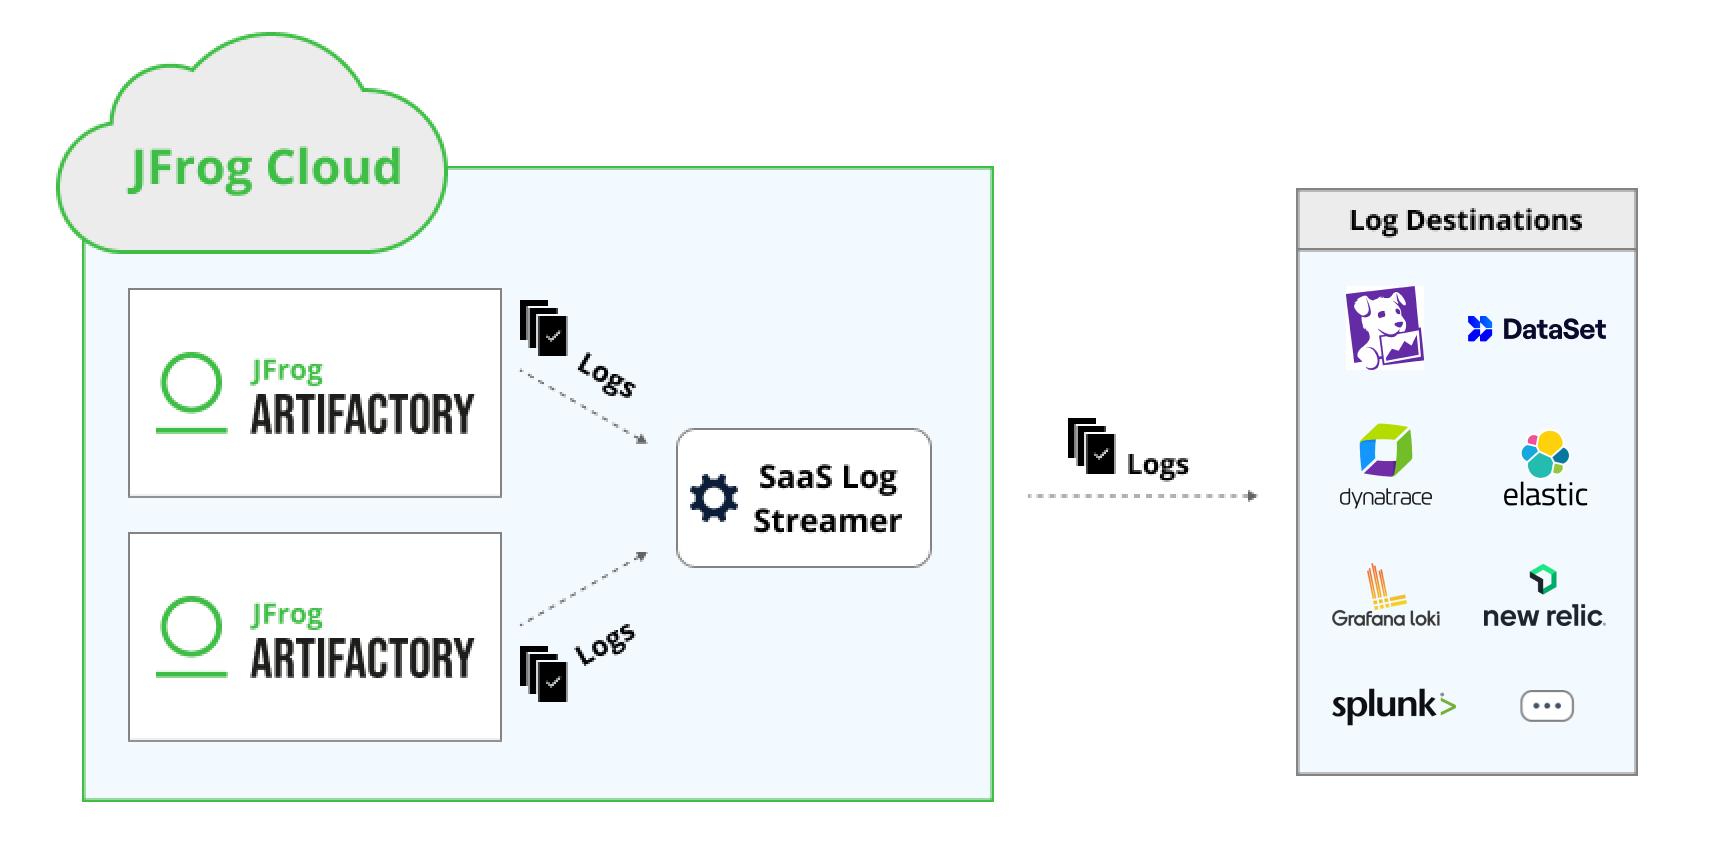
In the same way that JFrog SaaS instances are running on JFrog infrastructure, the same holds true for JFrog’s SaaS Log Streamer. You don’t need to install anything to get things going, as the log streamer retrieves all the necessary information from JFrog Artifactory instances, allowing only the relevant logs to pass through and eliminating the need for post-log filtering.
Out-Of-The-Box Log Streaming for JFrog SaaS Customers
By integrating the SaaS Log Streamer into the JFrog Platform capabilities, we continue to make our Cloud experience as complete and effective as possible, enabling organizations to accelerate their cloud migration efforts.
Currently the SaaS Log Streamer supports three log types:
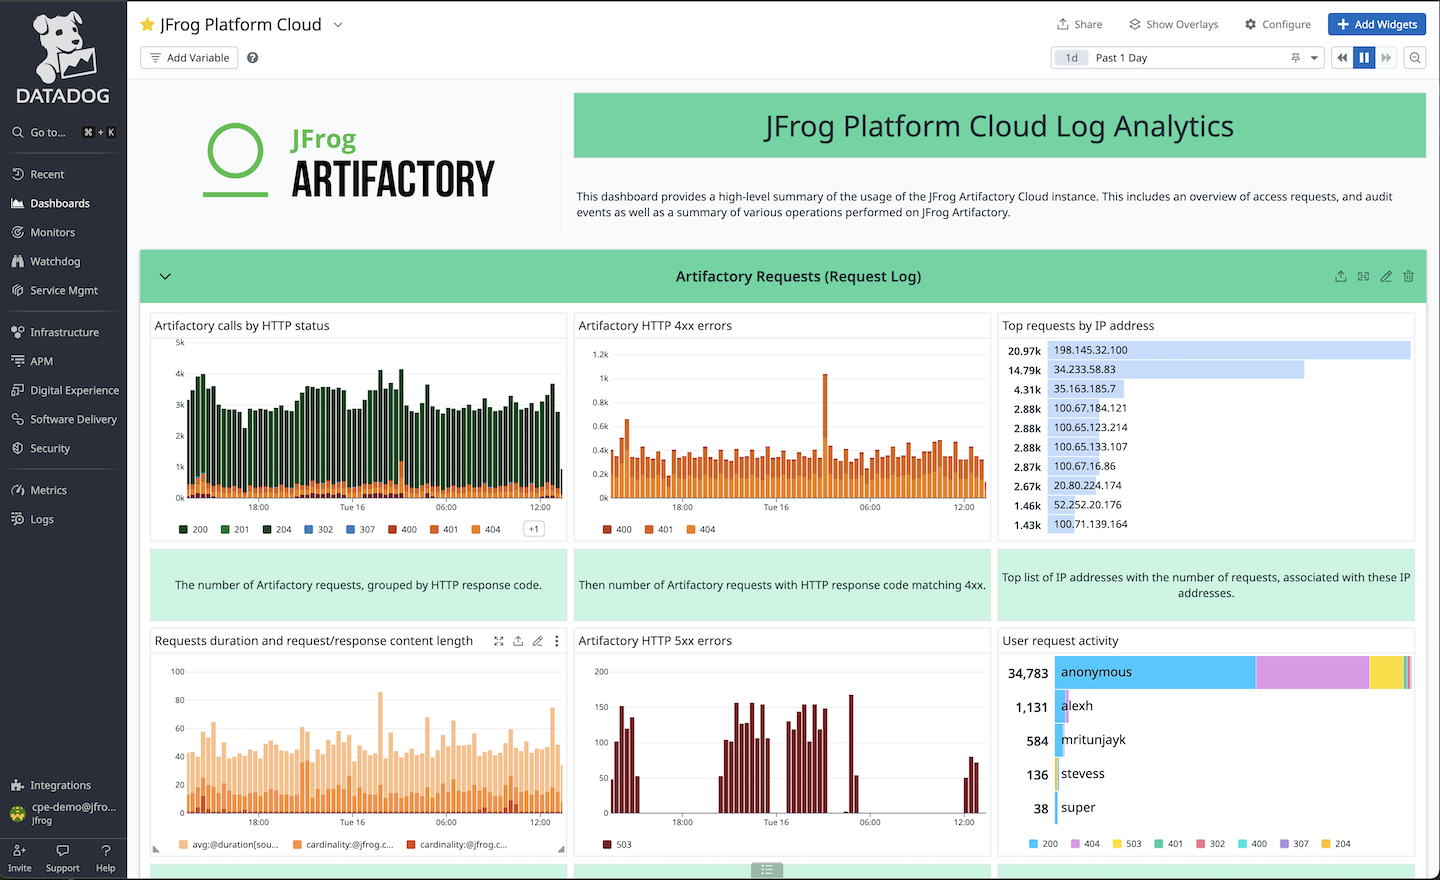
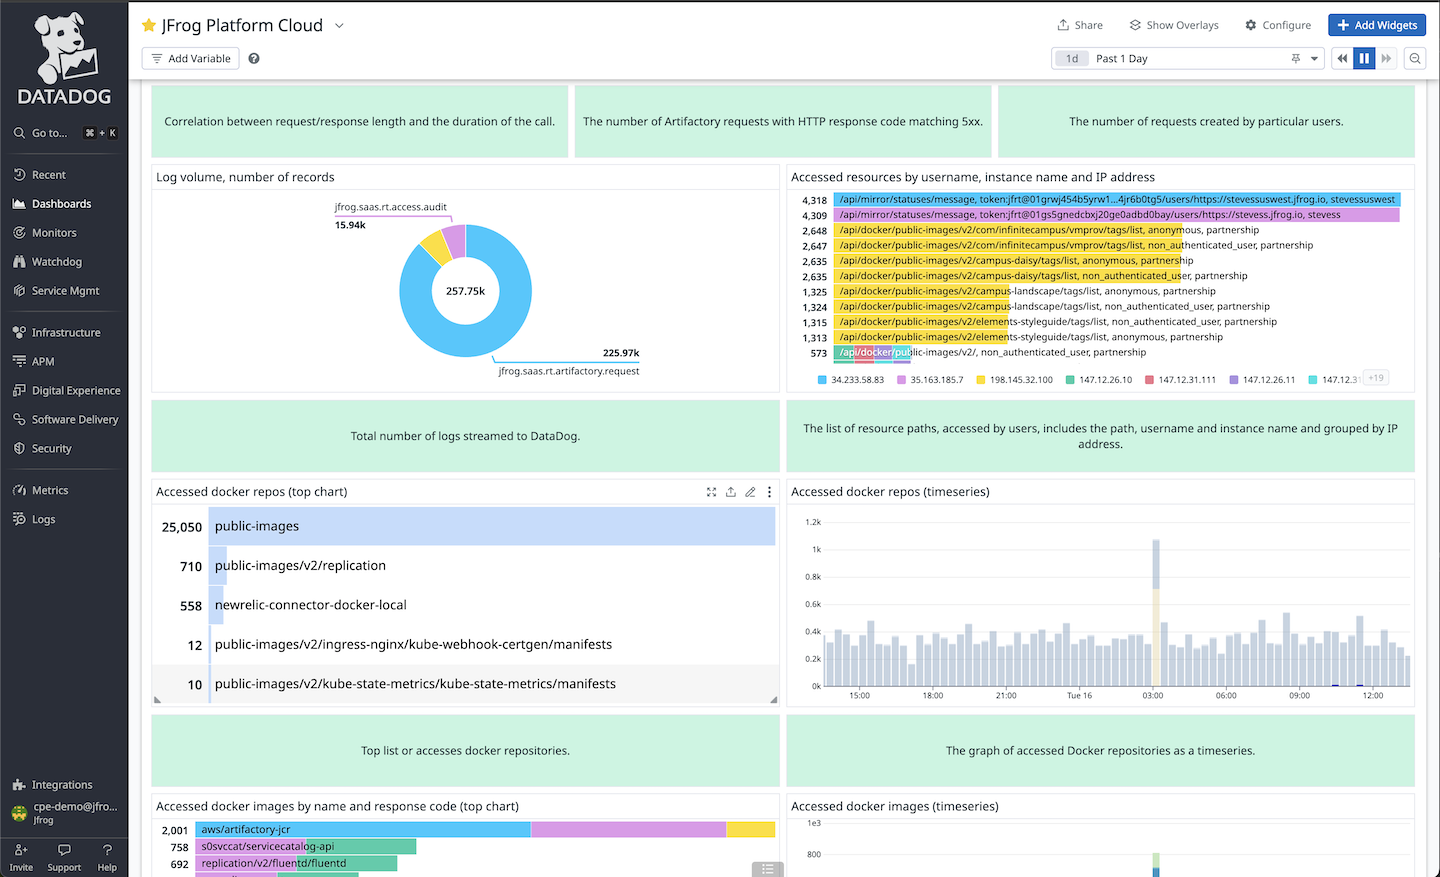
1. Artifactory-Request Logs are a set of logs that help monitor Artifactory incoming requests. These logs allow you to track the trend of all requests based on HTTP status codes and request methods. This data can provide useful insights such as which artifacts are most requested and who the heavy users are of certain artifacts. Here are some sample screenshots from a typical Datadog dashboard:
Sample dashboards showing Artifactory Log Messages imported into Datadog (Click images for full-size)
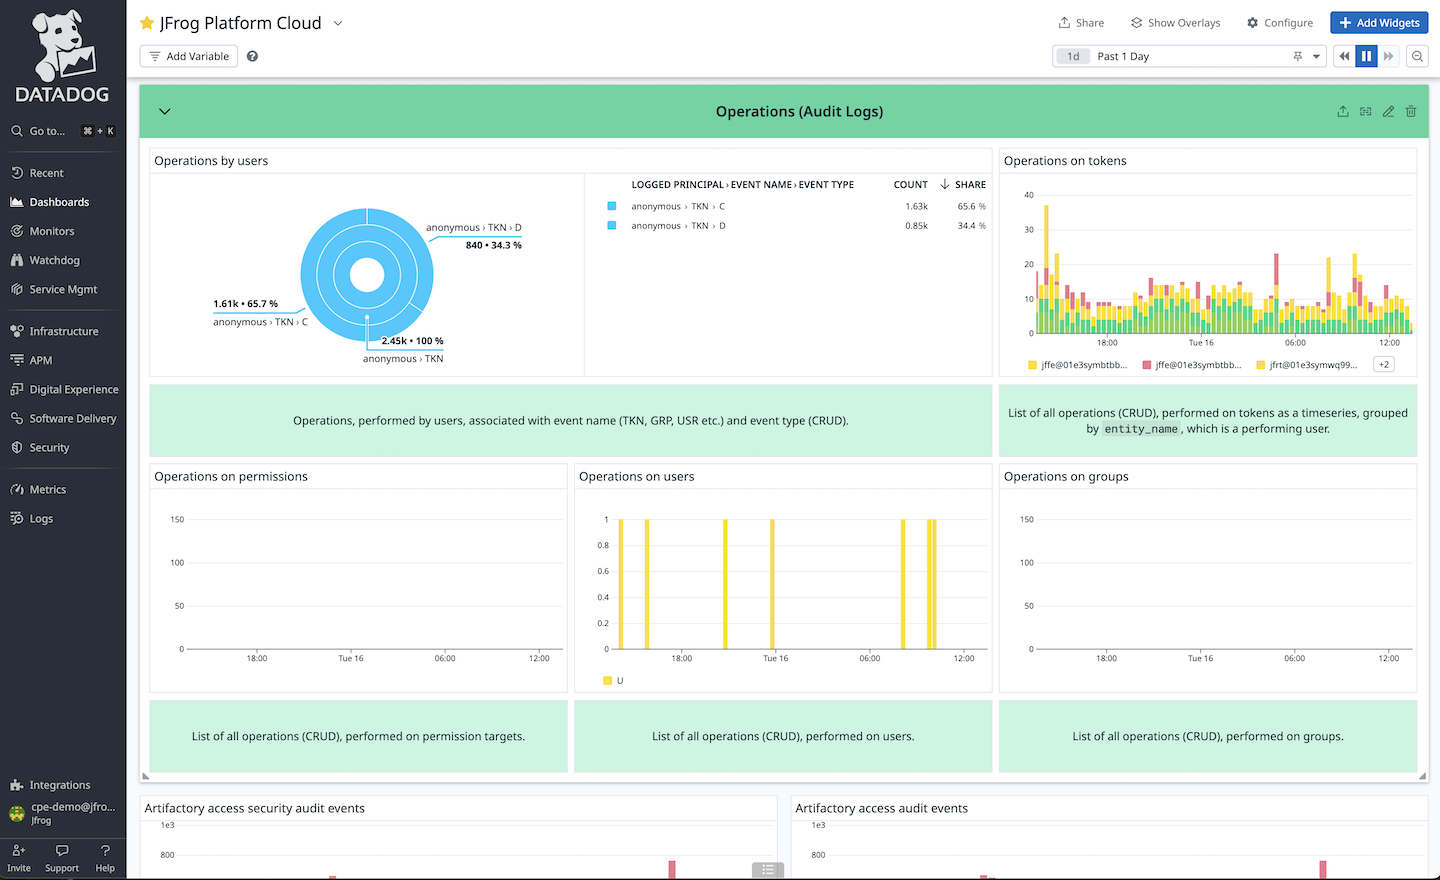
2. Audit Trail Logs (access-audit, access-security-audit) register all operations related to users, groups and permissions, enabling auditing and tracking capabilities for enforcement of security policies in your organization. Here is a sample screenshot of these logs from a Datadog dashboard:
Example of Audit Trail Logs imported from JFrog Artifactory into Datadog (Click image for full-size)
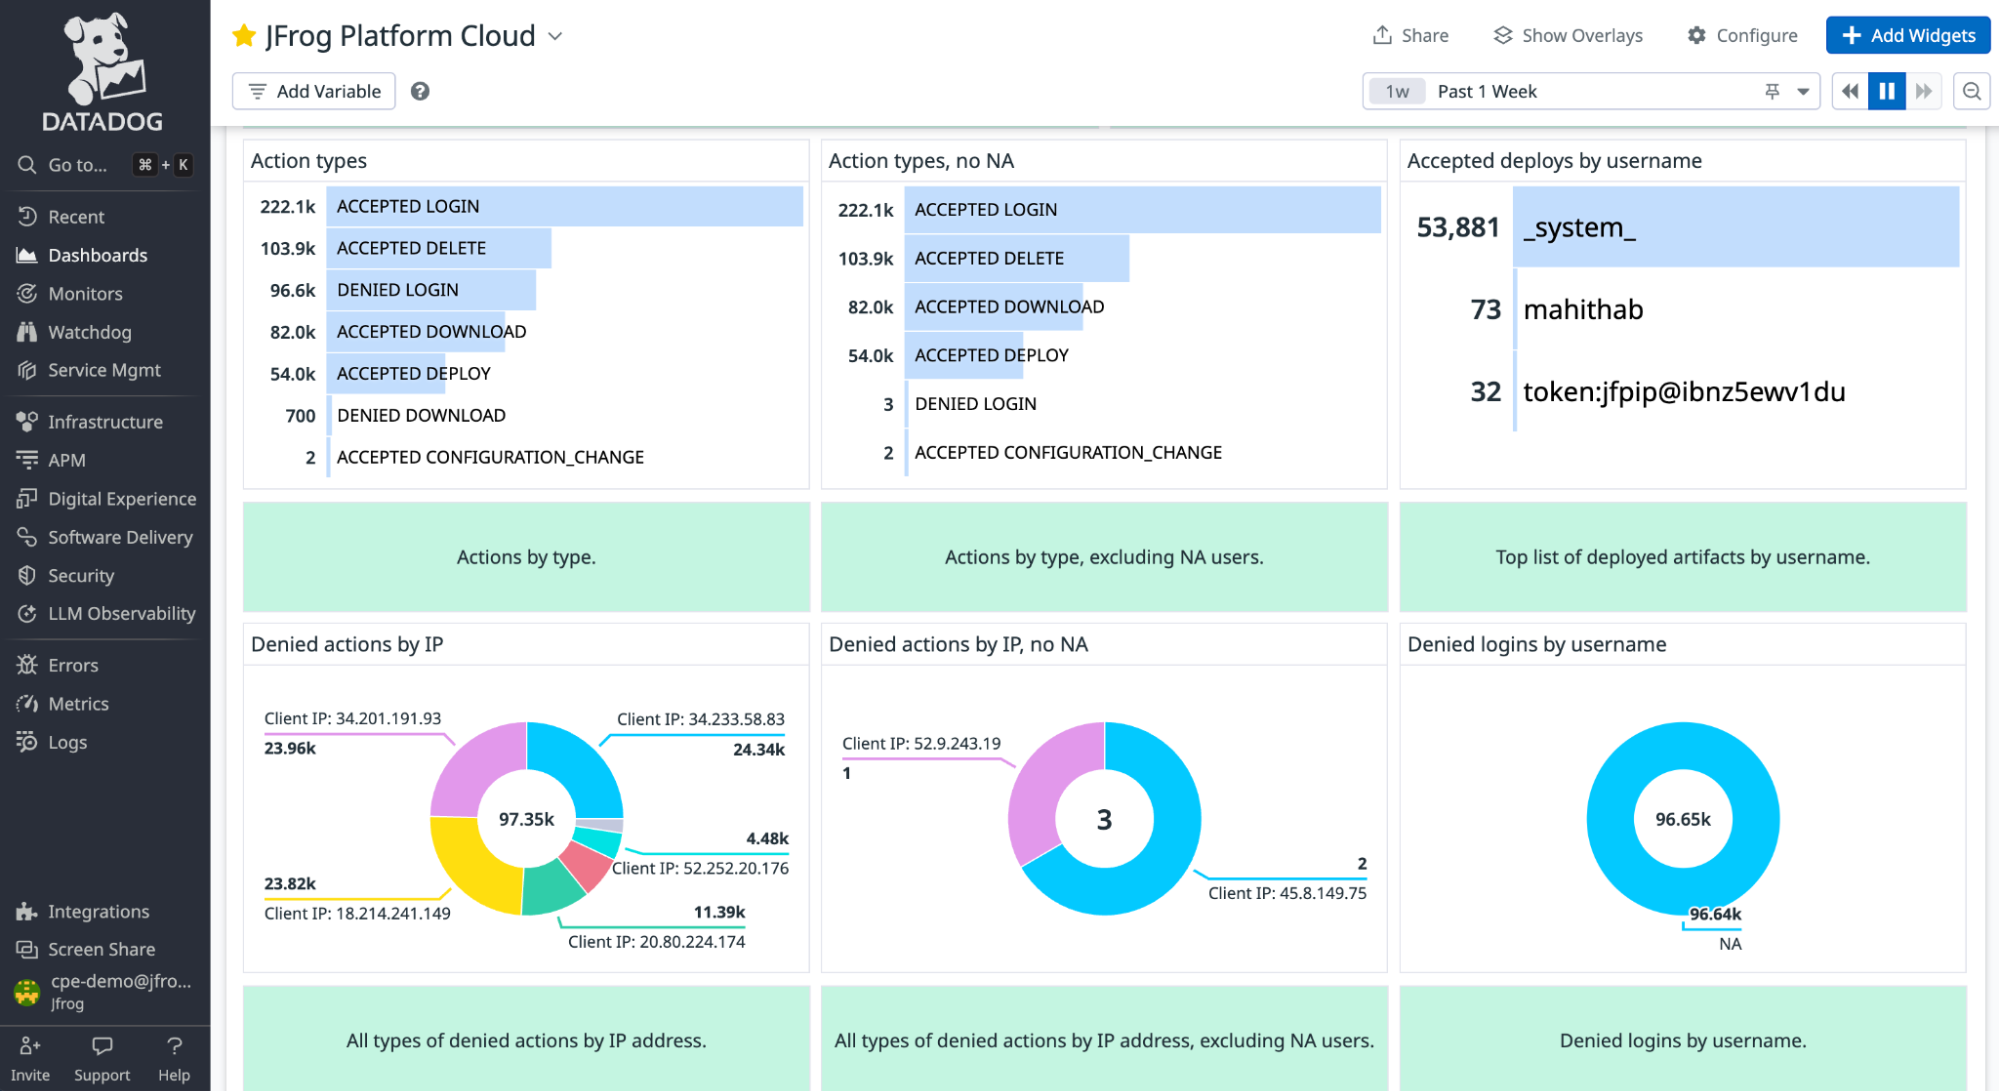
3. Artifactory Access Logs help monitor artifact access in the given Artifactory instance. These types of logs give you visibility into upload, download, or deletion of artifacts along with who took those actions. You can see who the top users are performing those actions. You can even look into users and IP addresses that were denied login access.
Sample dashboard based on Artifactory Access Log Messages (Click image for full-size)
These are just some examples of what your log dashboards may look like. You can leverage your APM to create your own dashboards and visualizations that meet your unique requirements by leveraging the data contained within the logs referenced above.
What’s Next for Cloud Log Streaming
[Updated November 27, 2024] We’ve recently added log vendor support for Dynatrace, Dataset, Elastic, Grafana Loki, and New Relic in addition to Datadog and Splunk. Support will also be provided for additional Artifactory log types, as well as those from other components of the JFrog Platform.
Get Started with Log Streaming
If you are a JFrog Enterprise+ SaaS customer using any of the supported APM providers as your log destination, please submit the form here and make sure to reference the SaaS Log Streamer.
After your submission is received, our team will enable your instance and notify you to input your APM credentials into MyJFrog to have the logs flowing within an hour. Guidance on how to access and input the appropriate information into the MyJFrog portal is available here.
For more on this and additional logging functionality, schedule a demo with our solutions experts.


