JFrog Cloud Native Innovation – Availability, Security Performance and Efficiency at Scale
JFrog is leading the way to faster software development cycles in cloud environments by leveraging the best native tools for the job
JFrog uses open source tools such as Kubernetes, Kubernetes Event-driven Autoscaling (KEDA), and Prometheus to develop its cloud development infrastructure and ensure tight integration with the three leading cloud providers AWS, GCP, and Azure. Let’s explore how JFrog cloud deployments leverage our cloud-native architecture to provide enhanced security and management capabilities for DevOps while ensuring high availability and a transparent user experience for developers.
How the JFrog Cloud Infrastructure is Built
JFrog provides a comprehensive solution for its cloud customers, by applying cloud-native practices and principles, using many CNCF open source tools to optimize deployments and services, while leveraging best-in-class solutions. JFrog cloud deployments are able to manage and secure microservices within our cloud architecture using both multi- and single-tenancy, as well as enabling auto scaling to address load and reliability concerns.
Our Kubernetes workloads are based on a microservices architecture and enable multi-tenancy to make sure that a single instance of any software application serves multiple customers. Each tenant’s data is isolated and remains invisible to other tenants, ensuring data privacy and security while sharing the underlying infrastructure and resources. This enables cloud developers to scale very quickly, both vertically and horizontally as required.
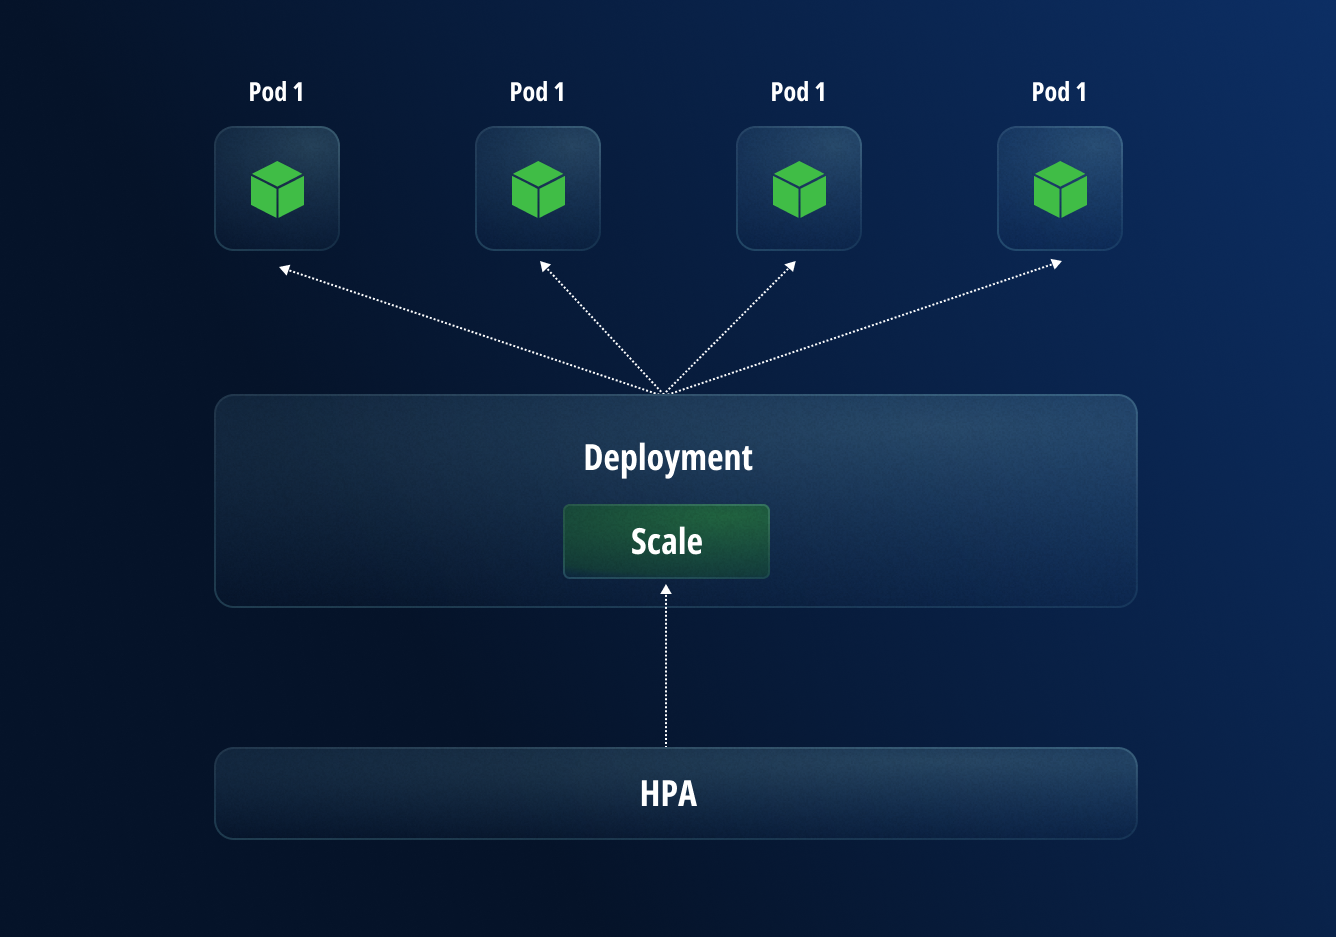
The first method for scaling uses Horizontal Pod Autoscaling to automatically update the workload’s replicas, such as a Deployment or StatefulSet, with the goal of automatically scaling the workload to match demand.
Horizontal scaling means that the system will automatically respond to increased loads by deploying additional Pods. This differs from vertical scaling, where Kubernetes assigns more resources, such as memory or CPU power to the Pods that are already running in the workload.

By using this methodology, even the largest production deployments can handle hundreds of thousands of requests per minute.
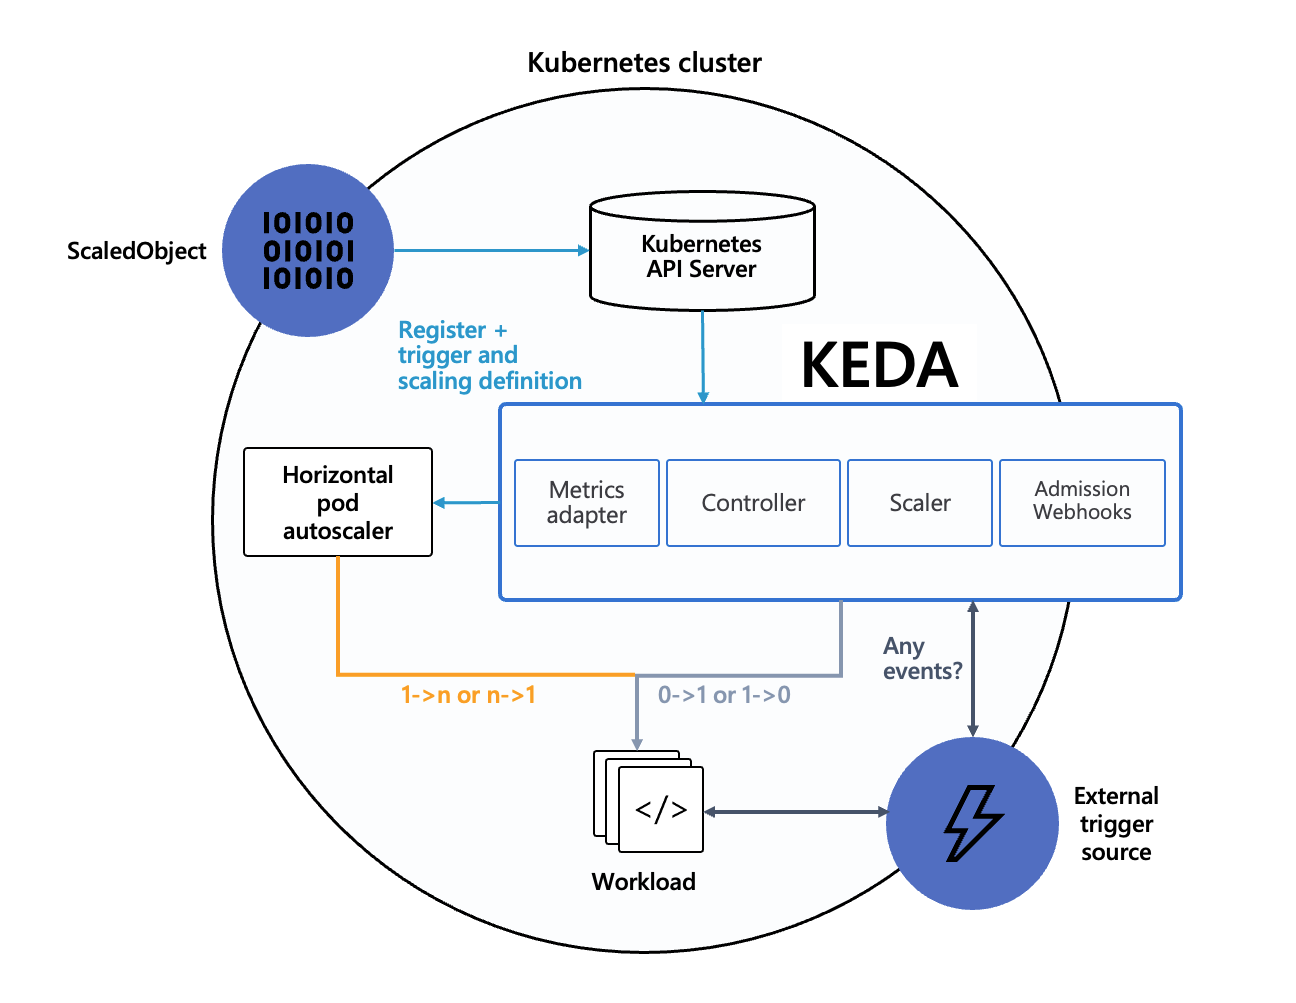
Per the diagram below, KEDA is an open-source project that enables Kubernetes to scale applications based on the number of events needing to be processed. It provides a flexible way to manage scaling for event-driven architectures, seamlessly integrating with various message brokers and services, which enables scaling of any service based on any metric.
Since JFrog itself is an enterprise software developer with distributed cloud based development environments on three continents, we also face the same real-life issues as our customers when it comes to securing cloud environments while shortening development cycles with the ability to scale quickly and securely. Achieving these goals is the main reason we selected KEDA to scale our Kubernetes workloads based on predefined triggers, such as events and metrics. Here are the top 5 reasons we recommend using KEDA:
- Automatic Scaling: KEDA enables developers to automatically scale Kubernetes workloads based on event-driven metrics such as queue length, message queue lag or custom metrics. This ensures that resources are allocated efficiently to handle fluctuations in workload demand.
- Optimized Performance: By dynamically adjusting resource allocation in real-time, KEDA helps ensure that Kubernetes applications have the necessary resources to maintain optimal performance, even during periods of high demand.
- Multiple Metrics: KEDA supports a wide range of metrics and external systems, allowing for more complex and tailored scaling strategies.
- Cost Savings: Efficient resource utilization means developers can avoid overprovisioning resources, which results in cost savings by only using resources as needed. This is particularly important in cloud environments where resources are billed based on usage.
- Improved Scalability: KEDA makes it easier to scale Kubernetes workloads up and down based on demand, allowing developers to respond quickly to changes in workload requirements without manual intervention.
How JFrog uses KEDA internally
We use KEDA in both JFrog Artifactory and JFrog Xray as part of our cloud native architecture in the following manner:
Artifactory is pre-installed with Apache Tomcat which is part of the JFrog Platform Deployment (JPD) architecture. So what happens when we start receiving a large amount of HTTP requests? In such cases we need to temporarily increase the number of pods. It is not, however, just an issue with CPU and memory, as we also need to check that we aren’t using too many Tomcat threads. Threads consume system resources and if there are too many threads, it can lead to resource exhaustion, causing the server to slow down or even crash.
An example of how JFrog utilizes KEDA is having the ability to create a KEDA scaler that monitors the utilization of Tomcat threads. The following shows a metric query that calculates the ratio of busy threads to the maximum configured threads over a 3-minute window:
 max(avg_over_time(tomcat_threads_busy_threads{application="Artifactory",
 namespace="<NAME_SPACE>", container="artifactory-app"}[3m])/
 avg_over_time(tomcat_threads_config_max_threads{application="Artifactory",
 namespace="<NAME_SPACE>", container="artifactory-app"}[3m]))
|
First, we check the number of busy threads with tomcat_threads_busy_threads
Then, we define tomcat_threads_config_max_threads which is the maximum number of threads configured in the Tomcat server.
The time window in our example is 3 min indicated by avg_over_time
To ensure scaling reliability and performance, it’s crucial to configure alerts properly. By using ScaledObject we can target the Deployment, StatefulSet or Custom Resource with /scale. We can also have multiple scales that can be defined as a trigger for the target workload and use ScaledJob to schedule K8s jobs based on events.
For the JFrog internal configuration, our Director of Development wanted to make our KEDA implementation more solid and reliable. To strengthen our operations, the security team decided on using Prometheus to provide a more robust set of metrics that can help make better informed scaling decisions, resulting in more responsive and efficient autoscaling in Kubernetes environments.
Here is an example of a Prometheus Alert Configuration:
 groups:
  - name: keda_alerts
    rules:
      - alert: KedaScaledObjectDownscaleStuck
        expr: rate(keda_operator_controller_last_reconcile_time_seconds{status="error"}[5m]) > 0
        for: 5m
        labels:
          severity: critical
        annotations:
          summary: "KEDA ScaledObject downscale too slow"
          description: "The KEDA ScaledObject is failing to downscale; check the KEDA operator logs."

      - alert: KedaScalerNotReady
        expr: sum(keda_operator_scaler_ready{status="false"}) > 0
        for: 5m
        labels:
          severity: warning
        annotations:
          summary: "KEDA Scaler is not ready"
          description: "One or more KEDA scalers are not ready, requiring immediate attention."

      - alert: KedaScalerReplicaCountTooHigh
        expr: (keda_scaledobject_status_replicas > keda_scaledobject_spec_minReplicas) and
        (keda_scaledobject_status_replicas > 5)
        for: 10m
        labels:
          severity: warning
        annotations:
          summary: "KEDA ScaledObject replicas too high"
          description: "The KEDA ScaledObject has more replicas than expected (>5).
          Check the configured triggers."
|
Explanation of Each Alert
Now let’s take a look a what each of these alerts actually mean:
1. KedaScaledObjectDownscaleStuck :
-
- This alert is triggered if there are any errors reported by the KEDA operator when reconciling the resource. It signals that KEDA might be having problems with downscaling the application.
2. KedaScalerNotReady :
-
- This alert checks if any KEDA scalers are not in a ready state. If they are not ready for 5 minutes, the alert is triggered, indicating there might be an issue with processing messages or events.
3. KedaScalerReplicaCountTooHigh :
-
- This alert checks if the number of replicas managed by a ScaledObject exceeds a defined limit, indicating that it might not be responding correctly to the metrics it should be monitoring.
Setting Up Prometheus to Use Alerts
1. Add the Alert Rules to Prometheus : You need to add the alert rule file path to your Prometheus configuration, typically found in prometheus.yml.
rule_files: - 'alert.rules.yaml' # Path to your alert rules |
2. Configure Alertmanager : After defining the alerts, don’t forget to configure Alertmanager to send notifications based on the alerts. Here’s a basic configuration for Alertmanager.
 global:
   resolve_timeout: 5m

 route:
   group_by: ['alertname']
   group_wait: 10s
   group_interval: 5m
   repeat_interval: 3h
   receiver: 'slack-notifications'  # Change this to your notification channel

 receivers:
 - name: 'slack-notifications'
   slack_configs:
   - api_url: ''
     channel: '#alerts'
     text: "{{ range .Alerts }}{{ .Annotations.summary }}: {{ .Annotations.description }}{{ end }}"
|
Tangible Results
As a leader in the industry, implementing these innovative cloud-native solutions in our own production environment shows our customers how we lead by example in providing high availability, improved performance, fast scaling, increased efficiency and enhanced security for enterprise cloud software development operations.
To learn more about our comprehensive cloud-native software development infrastructure, feel free to take a tour or schedule a one-on-one demo at your convenience.


