
JFrog Log Analytics with Datadog just got better!
Get JFrog Platform intelligence easily in your Datadog dashboard

The software supply chain today runs differently than it did just five years ago. The number of available tools, languages, and packages used have exploded. Further, the growing mix of OSS packages puts organizations at risk of outdated software, untracked dependencies, and non-compliant licenses. To add to the chaos, teams are now increasingly distributed and greater in number. All of this dramatically increases the number of inputs within the software supply chain.
JFrog’s new and improved Log Analytics integration with Datadog simplifies managing a chaotic software supply chain by allowing you to stream logs and metrics from your self-hosted JFrog Platform instance straight to your Datadog dashboard.
In this blog post we explain the significance of this update and demonstrate how it enables you to monitor your software supply chain in a single pane of glass.
Gather and deliver insights to help control and secure your Software Supply Chain
This updated integration helps deliver a wealth of valuable and actionable insights from the JFrog Platform to Datadog. Here’s how:
- The JFrog Platform sends insights directly from JFrog Artifactory and Xray to Datadog. The insights delivered fall into three main categories: Usage Data | System Performance | Security Data.
- For Datadog users, the insights from the JFrog Platform are received by Datadog under the following three categories: Logs | APM | Security.
The JFrog Platform produces approximately 25 different logs and surfaces actionable information from these logs into pre-built dashboards in Datadog enabling Datadog admins and SREs to get operational and usage insights from the JFrog Platform. By monitoring usage of Artifactory, admins and SREs are able to see which teams are using Artifactory, which images and repositories are being used the most, and who the heaviest users are. They can also track trends of upload and download traffic and monitor malicious and unanticipated activity to help identify urgent corrective actions.
These insights help answer questions such as:
- Is there a critical vulnerability that’s actively impacting my software today?
- Is there a license violation I should worry about?
- What repositories, artifacts, and builds are most frequently impacted?
- How many users are using impacted artifacts?
- Can I trace a vulnerability to a particular artifact and isolate it for a particular component?
See it all come together inside Datadog
This integration delivers mission-critical insights straight into Datadog as pre-configured dashboards. You can combine the resulting graphs, charts, and timelines inside Datadog to your liking. Datadog also allows you to create log views according to how you want to visualize the data coming from the JFrog Platform. For example, you might create a log view for your security team to show the origin/IP address of the log source but exclude the content column. Similarly, you can create log views tailored for specific teams based on what is more relevant to them.
The JFrog Artifactory dashboard is divided into three sections: Application, Audit, and Requests. Application tracks log volume and Artifactory errors; Audit tracks audit logs; and Requests tracks HTTP response codes, top 10 IPs for upload/downloads, etc.
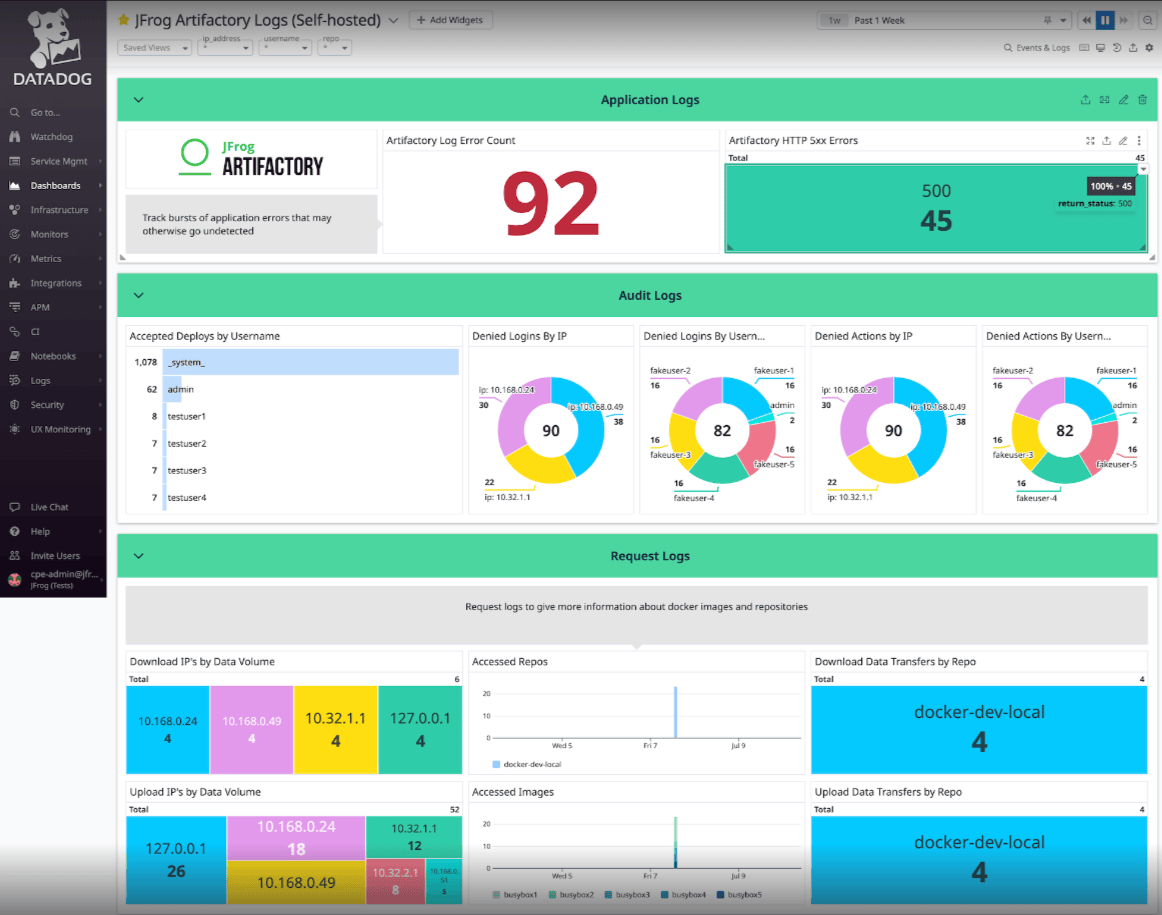
JFrog Artifactory Datadog Dashboard – Application, Audit and Request Logs
The JFrog Artifactory metrics dashboard tracks Artifactory System Metrics, JVM memory, Garbage Collection, database connections, and HTTP connections metrics.
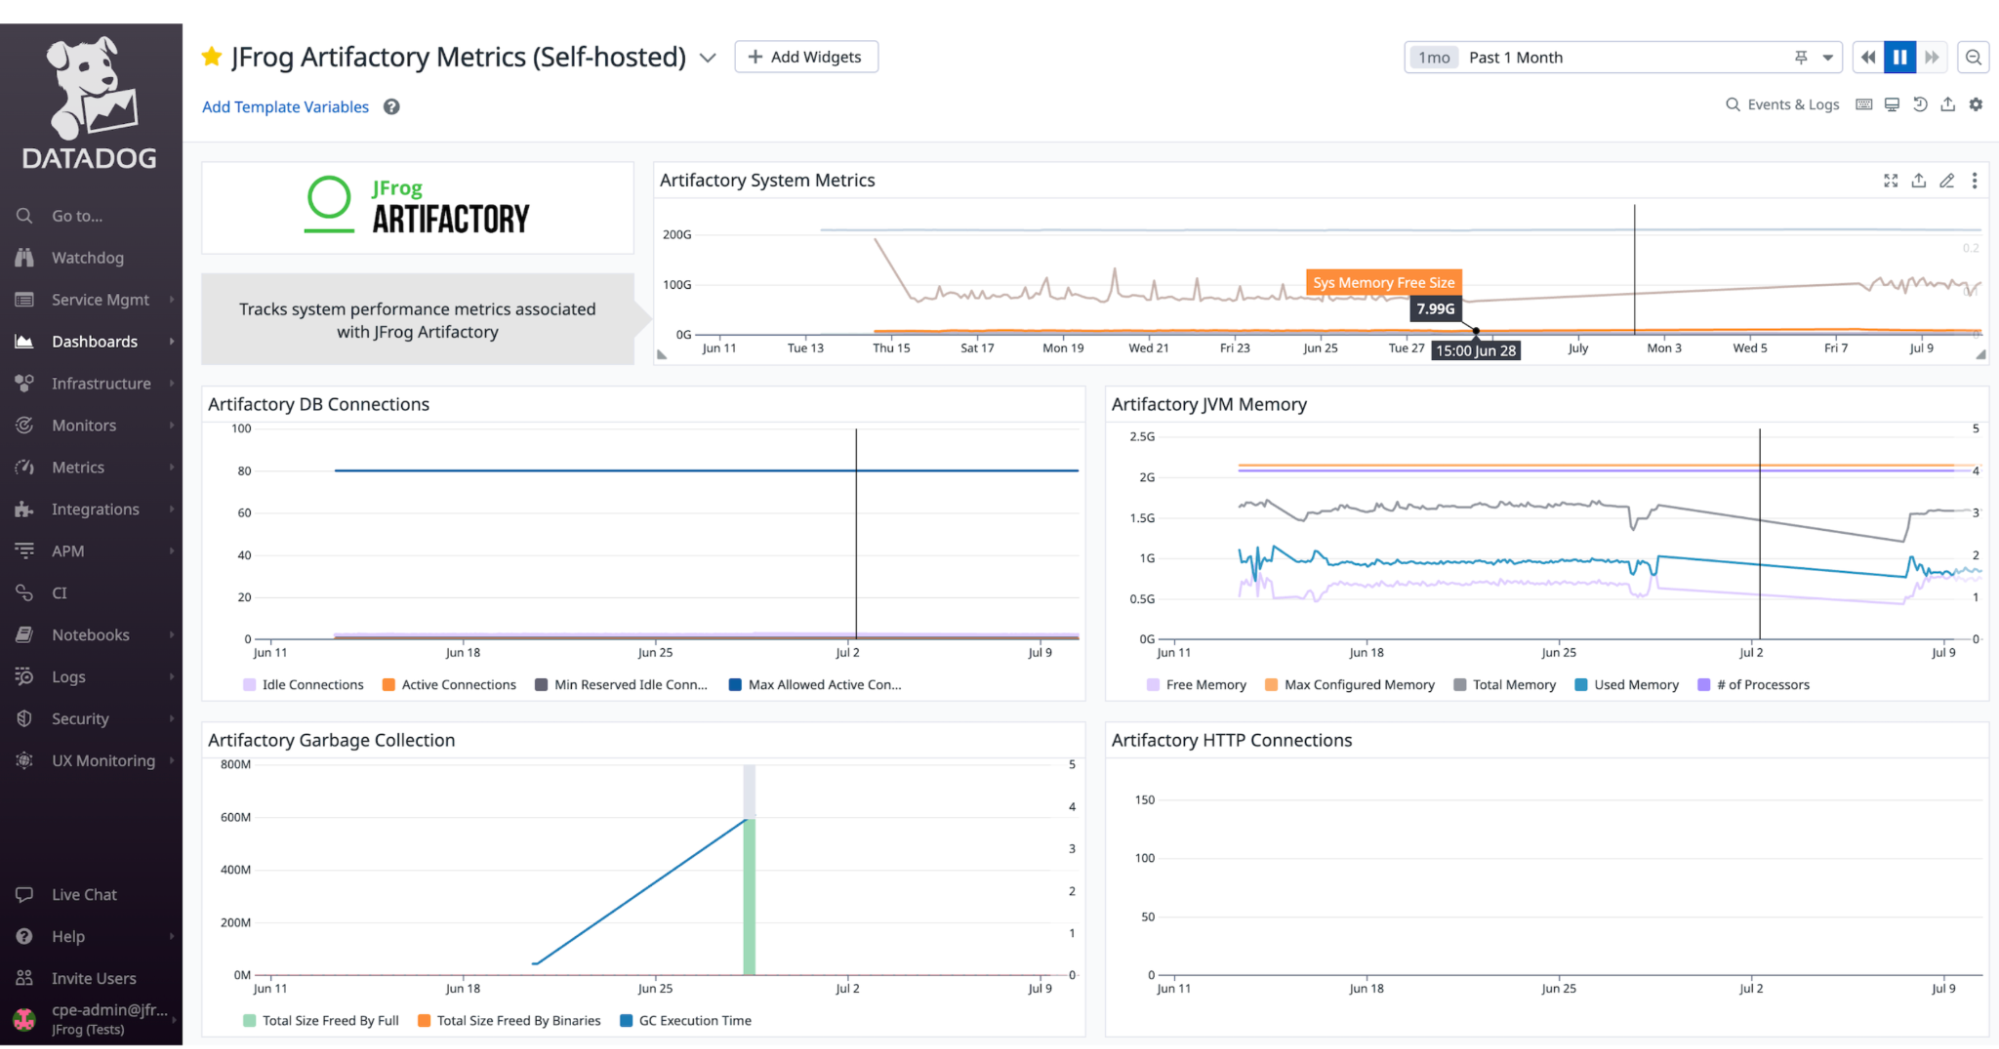
JFrog Artifactory metrics dashboard
The JFrog Xray violations dashboard provides an aggregated summary of all license violations and security vulnerabilities found by JFrog Xray. Information is segmented by watch policies and rules. Trending information is provided on the type and severity of violations over time, as well as insights on most frequently occurring CVEs, top impacted artifacts, and components.
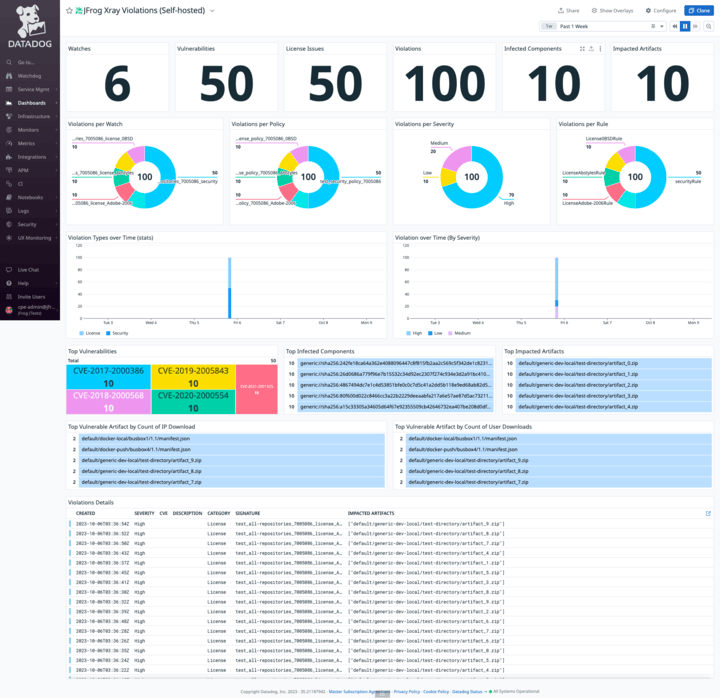
JFrog Xray violations dashboard
The JFrog Xray logs dashboard provides a summary of access, service, and traffic log volumes associated with Xray. Additionally, customers are able to track various HTTP response codes, HTTP 500 errors, and log errors for greater operational insight.
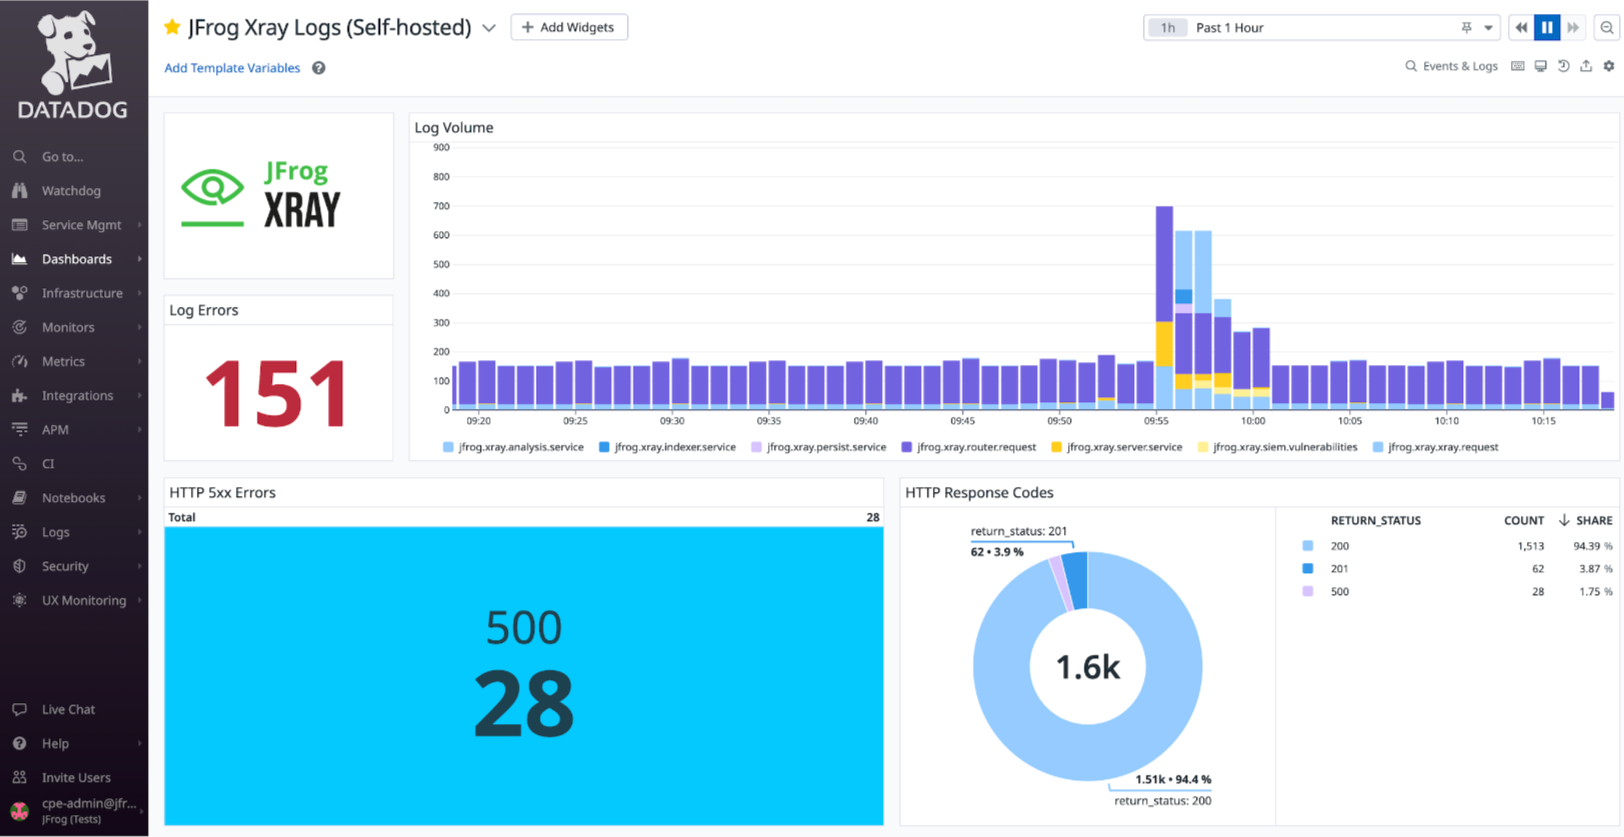
JFrog Xray logs dashboard
Introducing support for log pipelines in Datadog
The updated JFrog Log Analytics integration with Datadog also delivers improved dashboards and built-in support for Datadog’s log pipelines feature. Log pipelines provides simplified processing of logs from a variety of different formats. It also makes logs easily searchable and recognizable by Datadog and routes them to the updated JFrog dashboards in your Datadog view. Log pipelines also caters to each team’s unique formatting needs and naming conventions.
Get started with JFrog Log Analytics for Datadog
This integration combines the intelligence from JFrog with Datadog’s powerful visualization to deliver a superior observability experience for mutual JFrog and Datadog customers. Watch this screencast to see the set-up and learn best practices.
If you’re ready to get started, learn how to set up the integration step-by-step here.
Experience
JFrog Today
Discover how the JFrog Platform unites DevOps, DevSecOps and MLOps for secure, rapid software delivery.