Leap Forward and Be Proactive with DevOps Insights

Today, companies are adopting modern DevOps tools and practices at a rapid pace to increase high-quality software throughput and reduce inefficiencies (or as we call them, leaks) in the software development and delivery process. However, in most cases, there are very few metrics to prove that these DevOps-enabled pipelines are really performing better. So how do you measure the effectiveness of these initiatives? How do you define success criteria? How do you get visibility into the different tracks of DevOps activities? How do you tweak the various DevOps tools to achieve optimal performance?
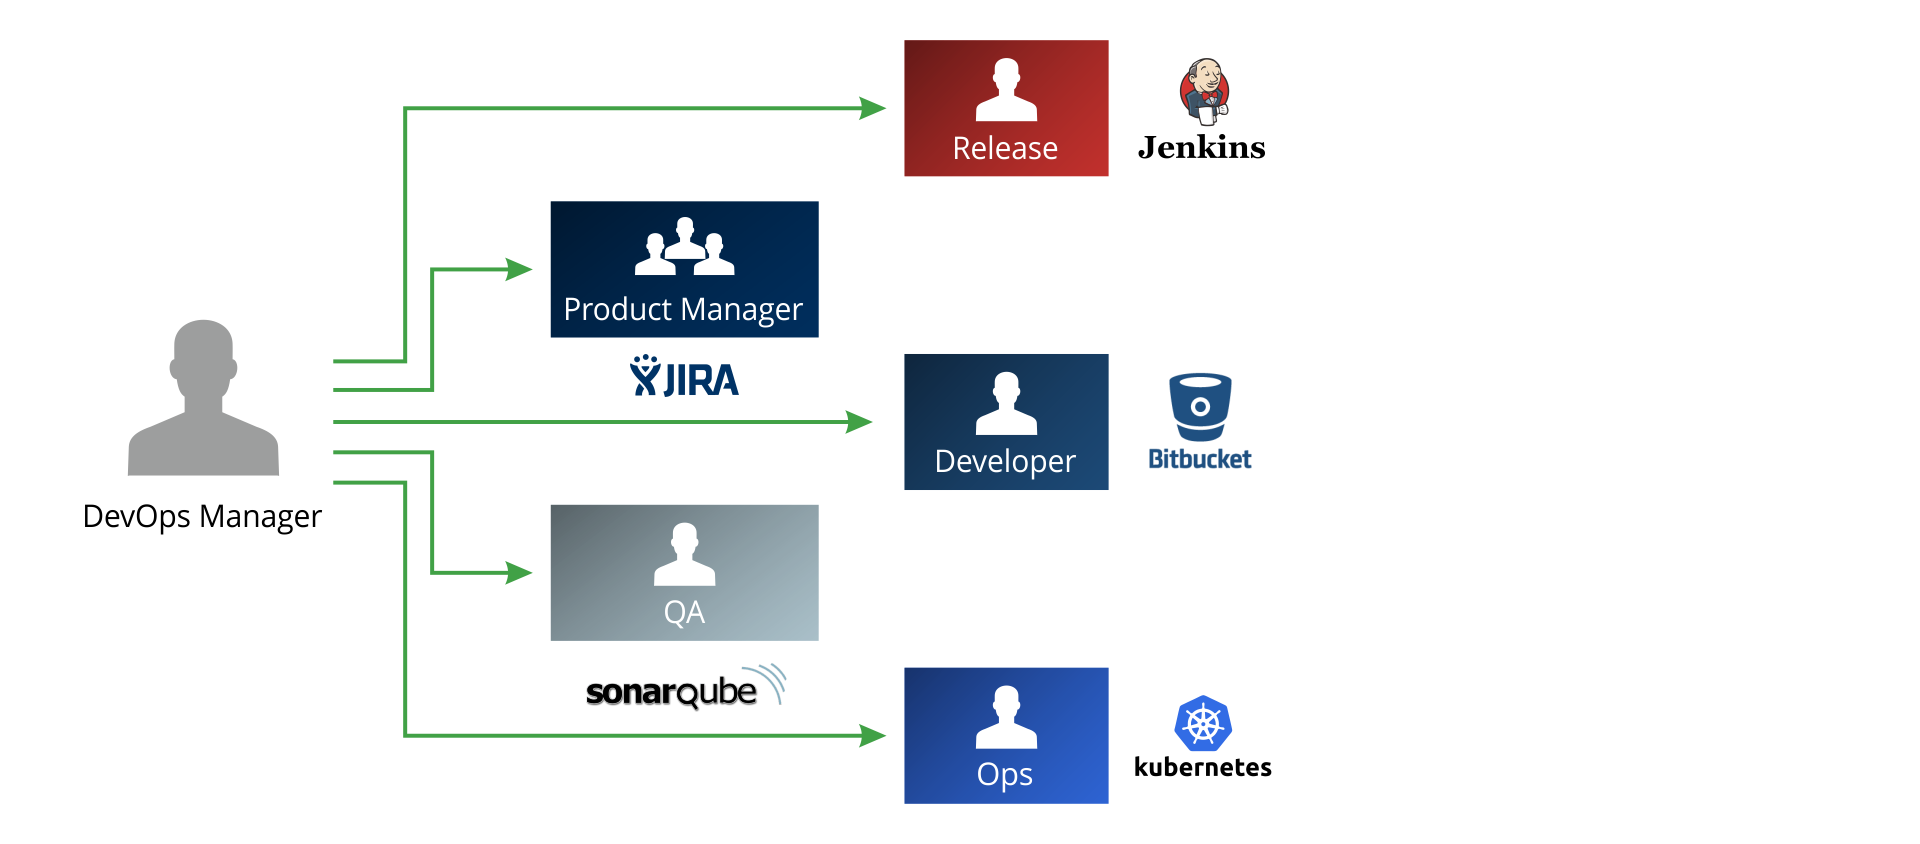
Figure 1: DevOps managers need insights
CloudMunch have developed a universal DevOps intelligence platform that provides DevOps teams with insights allowing them optimize their software build and release flow to realize an ROI. Recognizing that CloudMunch Insights were complementary to JFrog’s current DevOps solution, JFrog acquired CloudMunch with the goal of integrating them into one cohesive DevOps platform.
CloudMunch insights and JFrog Mission Control will be transformed into JFrog Insight, a new product that will be released by the end of this year. It will provide business intelligence that will help Release & DevOps managers to proactively and succinctly manage their entire Continuous Integration / Continuous Delivery (CI/CD) pipeline.
Challenges
Today, a key challenge faced by enterprises is the lack of visibility, metrics, and insights across the CI/CD pipeline. Adding to this challenge are the automation silos that are created by different tools for various stages of the CI/CD pipeline (from concept to build to delivery). While all of these tools are critical to the delivery of the software release and provide valuable data about the process, they each have a specialized dashboard resulting in a fragmented management process with limited insights. While some teams will try to build their own aggregated dashboard, most of these are neither enterprise class nor comprehensive, and building and maintaining them consume resources that could be allocated to tasks within the core competency of the organization.
Current Solution
Currently, the Release & DevOps managers do two things to get better control of their environment; they either do weekly checks of all the dashboards or they get anecdotal information from the developers. Neither of these methods is ideal.
Option 1: Weekly health checks
Release / DevOps managers try to stay up-to-date by doing a weekly check of different dashboards in their CI/CD ecosystem (figure 1). They look at the JIRA dashboard to check the progress of a software release and then move on to the Jenkins dashboard for the “Continuous Integration” status, and so on. As a result, they might end up checking 3-4 dashboards before they have any visibility into their CI/CD pipeline.
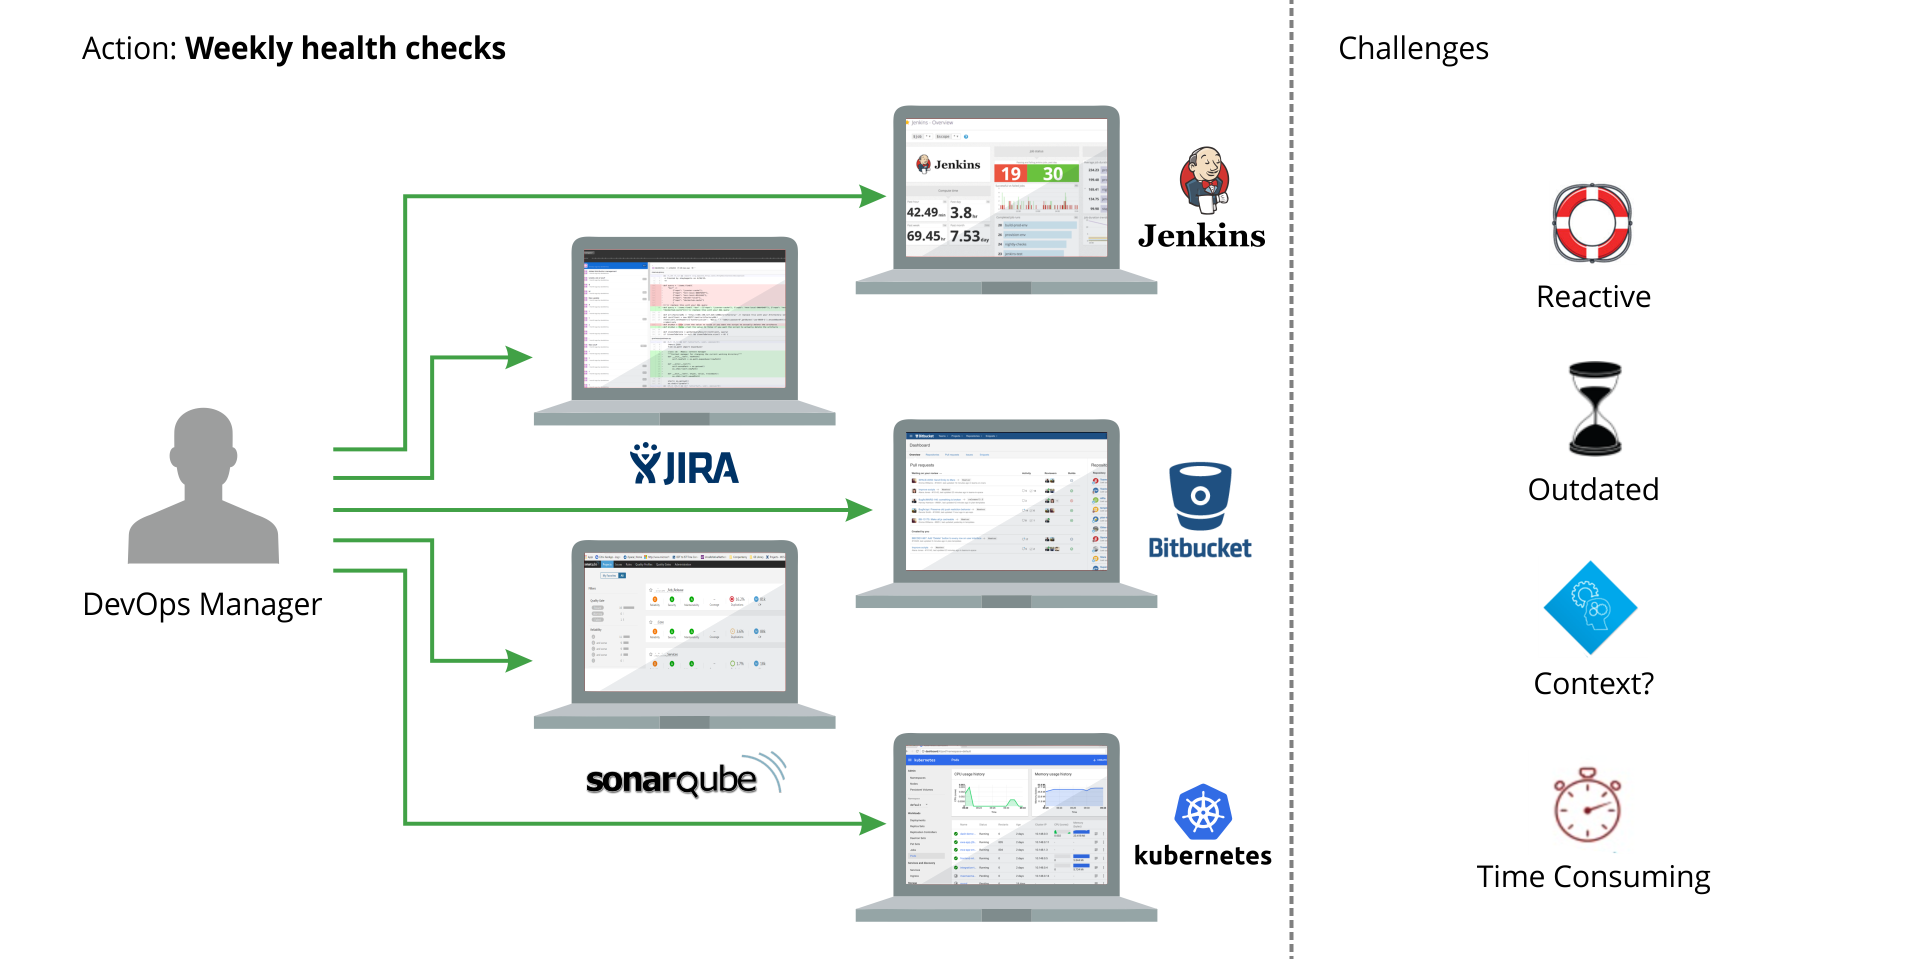 Figure 2: Weekly health checks
First, this is very time-consuming, and most managers end up with information overload. Second, most of the time they are late in getting critical information by going through this procedure. Ideally, they would want the information in real-time so they could make corrective decisions right away. Finally, the information they get might not make contextual sense for a release. For example, how does a certain matrix in JIRA have an impact in the CI pipeline (Jenkins), or how does a certain value in Kubernetes have an implication on the deployment and release of a binary.
Option 2: Anecdotal information
In cases when the Release/ DevOps managers don’t do weekly health checks, they rely on anecdotal information from the developers (figure 2) (yes, there are exceptions in which they do both). They walk around and get information in bits and pieces. The problem is that from an average developer’s point of view, things are mostly rosy (i.e. everything is on point and things are good), however, that is not the case most of the time.
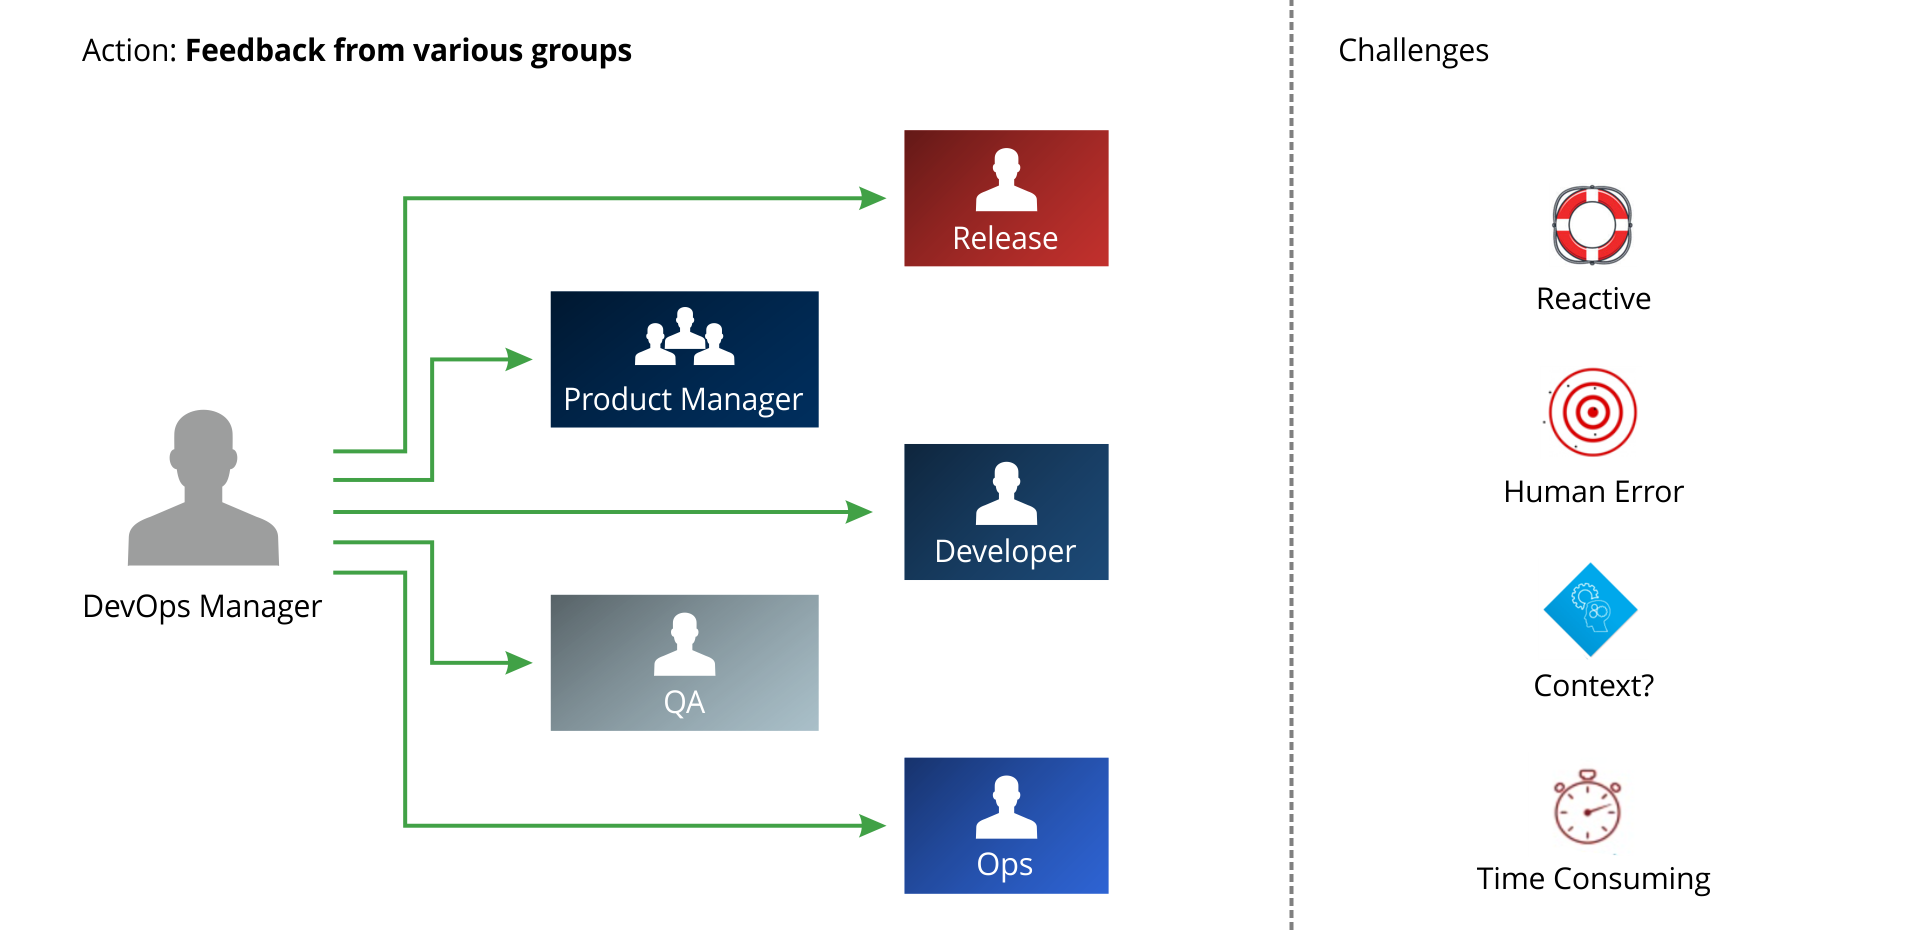 Figure 3: Anecdotal information
In short, the Release/DevOps managers end up managing the CI/CD pipeline based on unreliable information. In most cases, these managers are operating in a reactive mode and are therefore, prone to be in a firefighting state of mind rather than being proactive. For example, if there is a red flag (issue), then they are just managing the outcome of something else. There could have been an underlying factor behind the issue that could have been resolved in a proactive manner.
Ideal Solution: JFrog Insight
With JFrog Insight, we will be able to provide a single pane of glass for all metrics across the entire software release pipeline, from which the Release & DevOps manager could get insights to continuously optimize software releases (figure 3). It will connect to multiple tools that will enable companies to rapidly scale to the handle multiple teams, hundreds of integrations and terabytes of data. The Release & DevOps manager will get useful, correlated metrics and recommendations that can be compared to industry best practices.
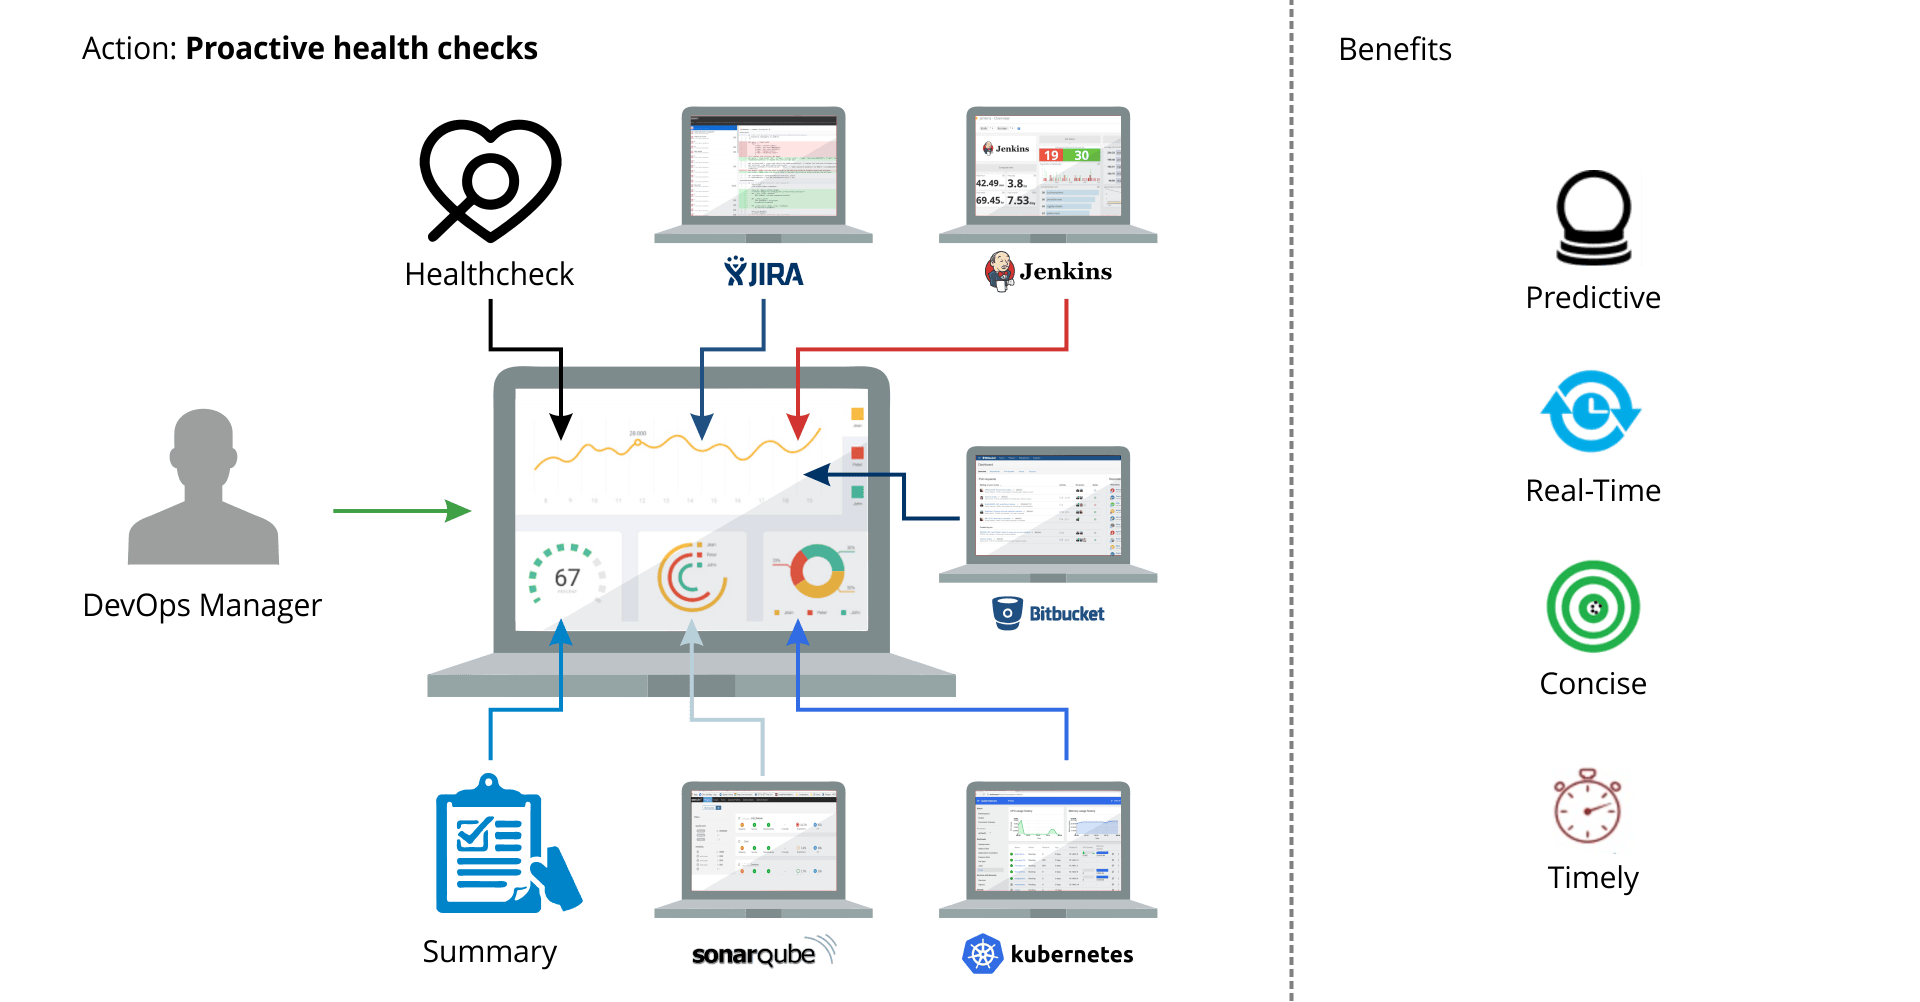 Figure 4: Ideal Solution, JFrog Insight
Managers leveraging JFrog Insight will have the ability to get an instant health-check of their CI/CD pipeline with one click. Plus, they will have a summary that provides them with meaningful data to manage their teams, processes, and return on investment (ROI).
Summary
In order to succeed in today’s digital world, the adoption of DevOps tools including data measurement and improved software update release cycles are key. JFrog Insight will provide the insight layer that will share the DevOps flow analytics. We will be able to provide universal insight (BI) for all the popular DevOps tools such as JIRA, GitHub, Jenkins, Kubernetes, SonarQube, Artifactory, Xray and more making JFrog Insight the first universal DevOps dashboard for actionable DevOps intelligence.
To be among the first to receive updates about JFrog Insight, REGISTER HERE.


