

Don’t let Prometheus Steal your Fire
Real world secrets exposed by unsafe defaults
Update April 2026 – Prometheus is now on version 2.55+ and its security features have matured significantly since this post was written. In addition to basic auth and TLS, Prometheus now supports mutual TLS (mTLS) with client certificate verification, configurable minimum TLS version (default TLS 1.2), and cipher suite selection. Despite these improvements being available for 5 years, exposed Prometheus endpoints remain common. The security guidance in this post still applies; we’ve updated the configuration sections below to reflect current best practices.
Background
Prometheus is an open-source, metrics-based event monitoring and alerting solution for cloud applications. It is used by nearly 800 cloud-native organizations including Uber, Slack, Robinhood, and more. By scraping real-time metrics from various endpoints, Prometheus allows easy observation of a system’s state in addition to observation of hardware and software metrics such as memory usage, network usage and software-specific defined metrics (ex. number of failed login attempts to a web application).
Since the numeric metrics captured by Prometheus are not considered sensitive data, Prometheus has held an understandable policy of avoiding built-in support for security features such as authentication and encryption, in order to focus on developing the monitoring-related features. This changed in January 2021 with version 2.24.0 where Transport Layer Security (TLS) and basic authentication support were introduced.
Due to the fact that authentication and encryption support is relatively new, many organizations that use Prometheus haven’t yet enabled these features and thus many Prometheus endpoints are completely exposed to the Internet (e.g. endpoints that run earlier versions), leaking metric and label data.
So – is this data really non-sensitive as was presumed?
In this blogpost we will present results from a large-scale unauthenticated scraping of publicly available and non-secured Prometheus endpoints, which contain many types of sensitive data that were exposed, often without the developer’s knowledge. In addition to presenting the most common configuration issues we’ve found in real-world applications, we also demonstrate how developers and other users can deploy Prometheus in a more secure manner.
Architecture
The diagram below shows a simplified structure of the Prometheus architecture.
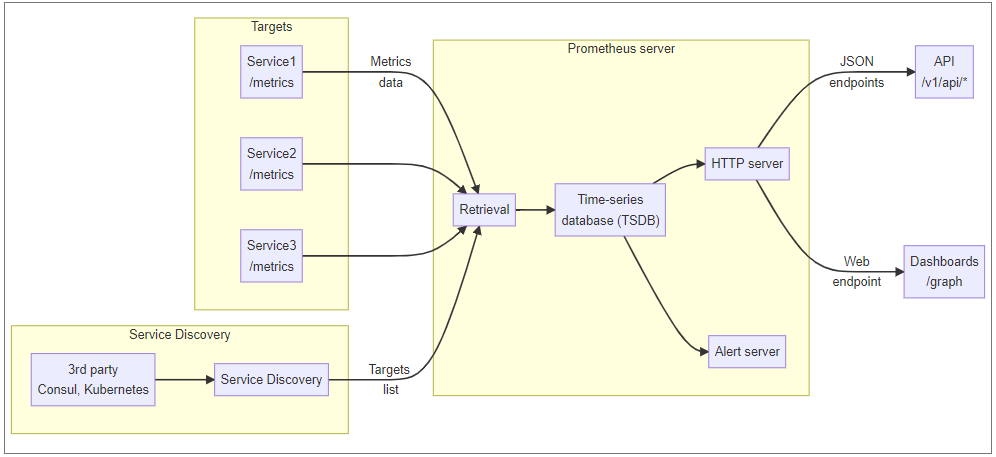
Prometheus’ retrieval job, also called the scraper, pulls data from target services, aggregates it, and passes it to the database. Prometheus’ HTTP server makes this data available in JSON format through API endpoints or in a visual HTML form through the /graph endpoint.
In the simplest case, Prometheus takes a list of scraping targets (IP addresses and ports) from a static list (or a file) called static_configs present in Prometheus’ YAML-based configuration file. More complex dynamic environments, where new instances might be brought up at any time, use service discovery mechanisms, which provide a list of machines to monitor and presents information of how these machines are organized.
Scraping targets expose their metrics as a text file with key-value records, with optional “label” data. Each record has a helpline, describing the purpose of the metric and type definition, instructing Prometheus how to interpret the value.
# HELP go_info Information about the Go environment.
# TYPE go_info gauge
go_info{version="go1.16.7"} 1
# HELP go_memstats_alloc_bytes Number of bytes allocated and still in use.
# TYPE go_memstats_alloc_bytes gauge
go_memstats_alloc_bytes 6.9728224e+07
# HELP go_memstats_alloc_bytes_total Total number of bytes allocated, even if freed.
# TYPE go_memstats_alloc_bytes_total counter
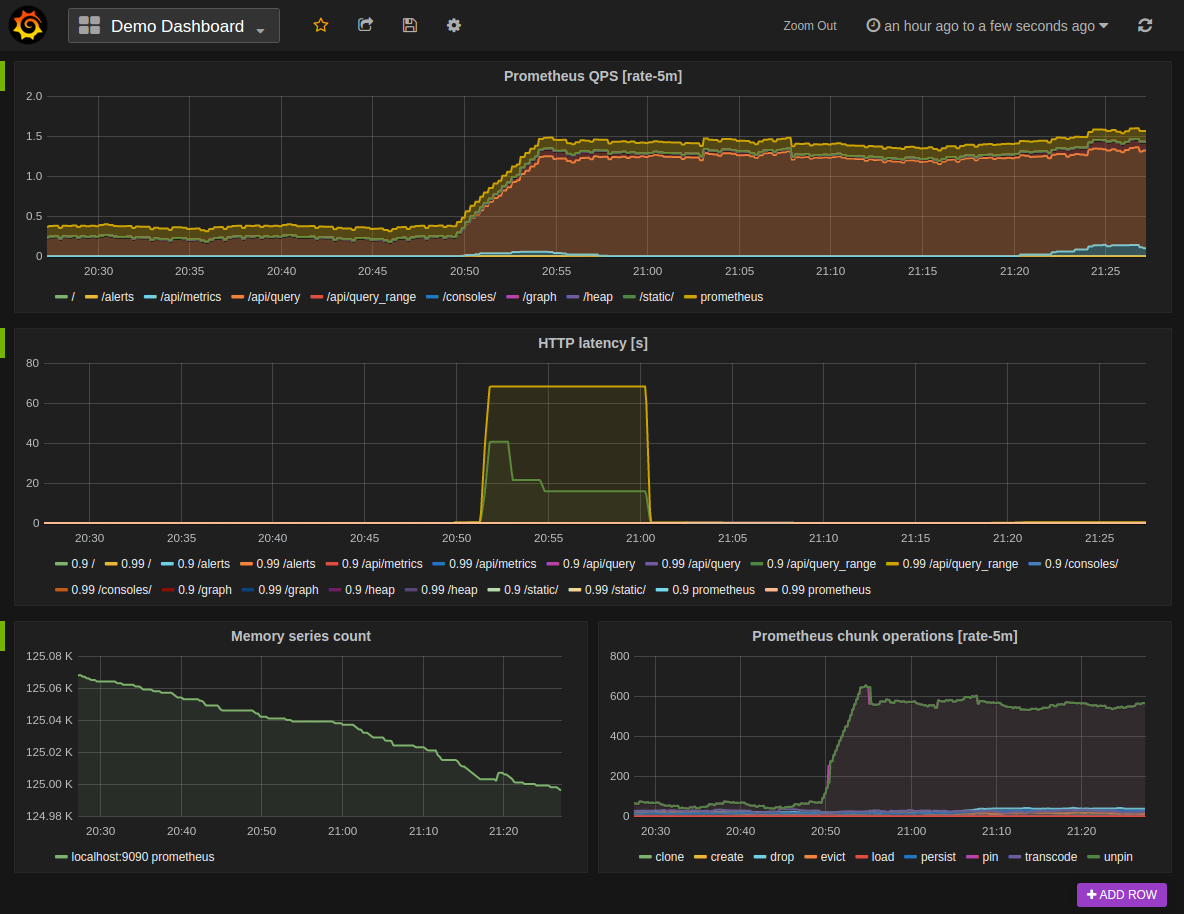
By using Prometheus’ support for visualization plugins (such as Grafana), the views of the aggregated data can be customized to the user’s needs (example graph below).
Scraping the Prometheus endpoints
Note: The Shodan and ZoomEye numbers cited here are from our original 2021 research. The exact count will differ today, but exposed endpoints remain prevalent.
As mentioned, the Prometheus service historically was presumed to allow public access. This was explicitly stated in the Robust Perception blog, and the official documentation says:
“It is presumed that untrusted users have access to the Prometheus HTTP endpoint and logs. They have access to all-time series information contained in the database, plus a variety of operational/debugging Information.”
Thus, when we started looking for publicly-exposed Prometheus endpoints, we were expecting most of them to be world-accessible without authentication – and we were correct.
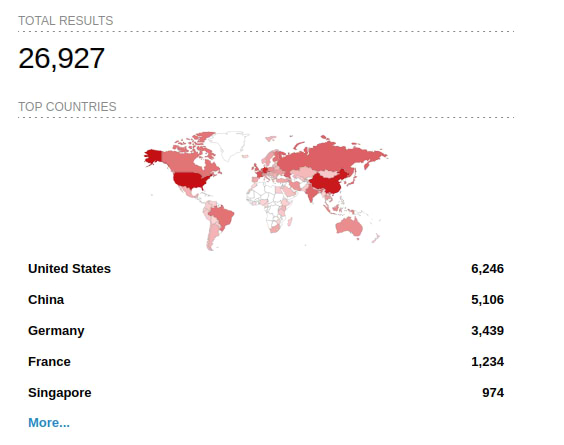
Using search engines like Shodan or ZoomEye it’s extremely easy to find tens of thousands of Prometheus endpoints. The most effective single query we’ve seen in Shodan, was to look for Prometheus endpoints by the Web UI’s favicon ![]() .
.
This specific query (http.favicon.hash:-1399433489) returns almost 27K hosts in Shodan and 43K hosts in ZoomEye. By iterating automatically over these exposed endpoints, we’ve seen that 100% of the endpoints returned from this query had publicly-accessible data (meaning no authentication mechanisms were in place).
An absence of access restriction might make sense for metrics data, since most of the metrics are numbers that can be useful from a DevOps engineer perspective, but are typically useless for attackers. For example, these are values describing a CPU load or a number of requests sent to the service:
node_cpu_seconds_total{cpu="0",mode="nice"} 2582.99
node_netstat_Udp_OutDatagrams 2.4580101e+07
node_memory_Cached_bytes 1.293774848e+09
In some cases, metrics expose software versions and host names, which can be used by an attacker for low-sensitivity reconnaissance before exploiting a particular server or for post-exploitation techniques such as lateral movement:
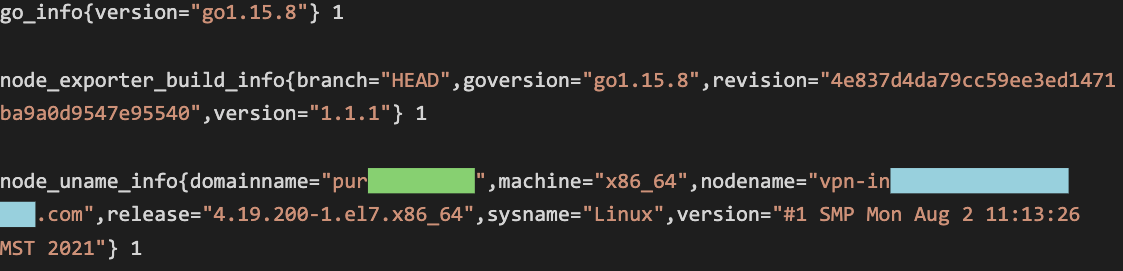
However, contemporary Prometheus endpoints are usually not statically configured, but rather use dynamic service discovery or even supplied as a turn-key solution by the cloud provider (ex. GKE). In these cases, the deployment of Prometheus may expose a plethora of operational information across an organization’s endpoints, including much more sensitive information, as we’ll now demonstrate.
Exposure of sensitive operational information
Let’s review some real-world examples that contain operational information, to better understand what sensitive information they may leak and why organizations should prioritize secure deployment of Prometheus.
We will group the information by the endpoint from which it was scraped:
/api/v1/status/config
The config endpoint returns the loaded (YAML) configuration file.
This file also contains addresses of targets and alerting/discovery services alongside the credentials required to access them. Usually, Prometheus replaces the passwords in the credentials config configuration field with the placeholder <secret> (although this still leaks the username):
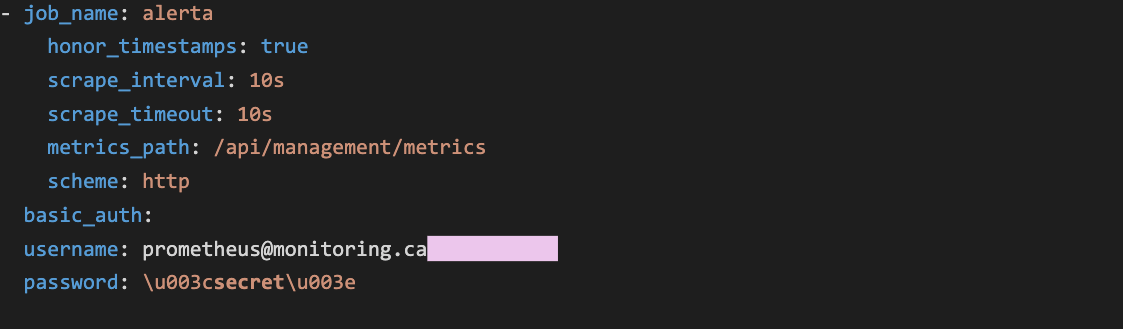
However – since Prometheus does not directly monitor, remove, or otherwise mask usernames and passwords provided in URL strings, this sensitive data is completely leaked:
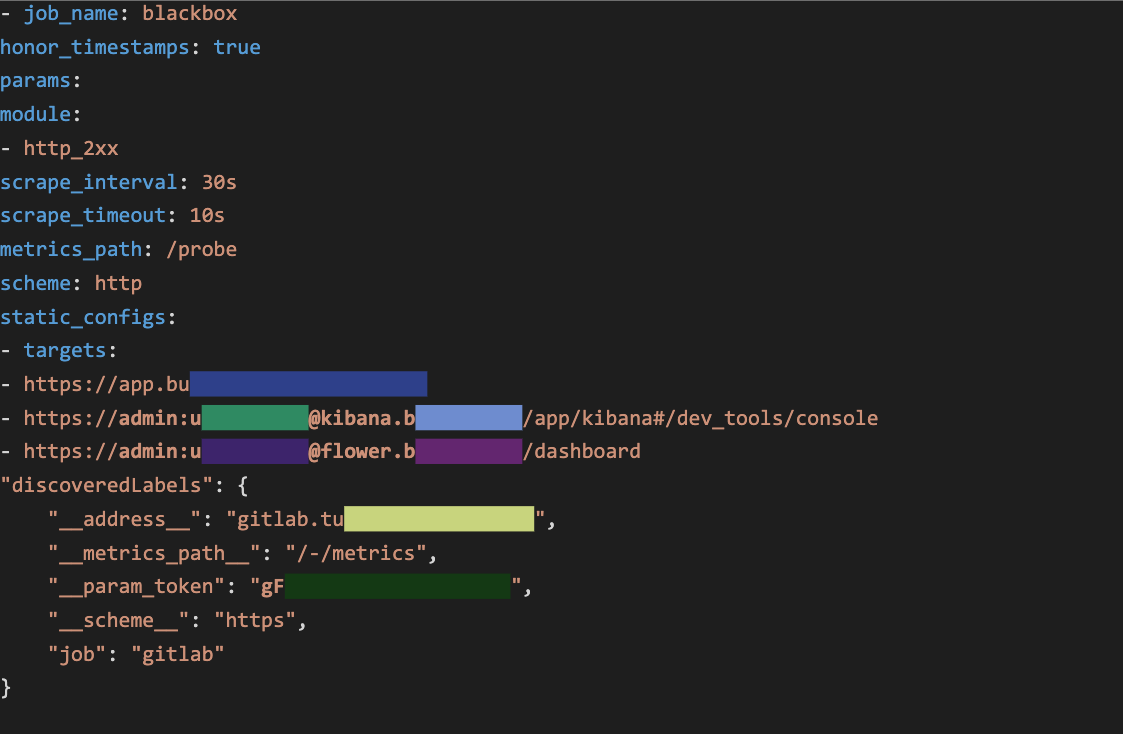
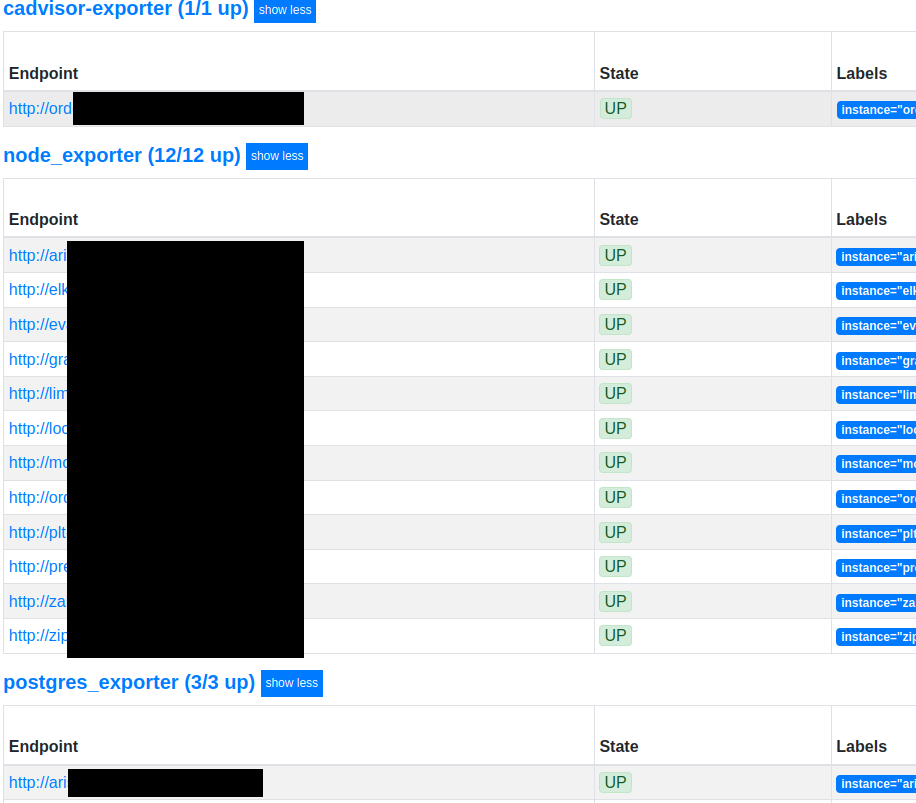
/api/v1/targets
The UI endpoint /targets exposes services belonging to the infrastructure, including their roles and labels:
The API endpoint /api/v1/targets shows this information in depth (and in a parsable JSON format).In addition to showing the target machine addresses, the endpoint also exposes metadata labels that are added by the target provider. These labels are intended to contain non-sensitive values, like the name of the server or its description, but various cloud platforms may automatically expose sensitive data in these labels, oftentimes without the developer’s knowledge.
For example, when using GCE-based service discovery (gce_sd_configs), part of the exported metadata is a label with an SSH public key, leaking the user and machine name:

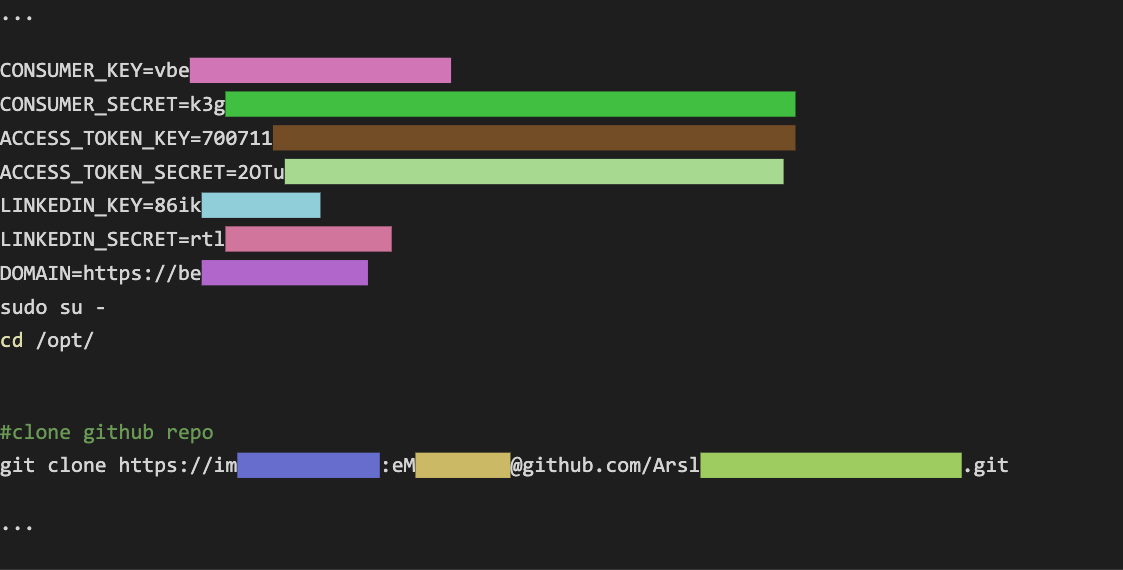
A much more concerning label is __meta_gce_metadata_startup_script which contains the entire startup script used for the GCE VM. Many developers choose to initialize secrets in these scripts and as a result these credentials are leaked:
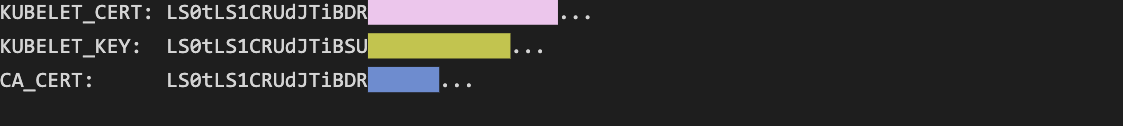
Another problematic GCE label is __meta_gce_metadata_kube_env, which contains environment variables for the Kubelet, and may contain sensitive credentials:
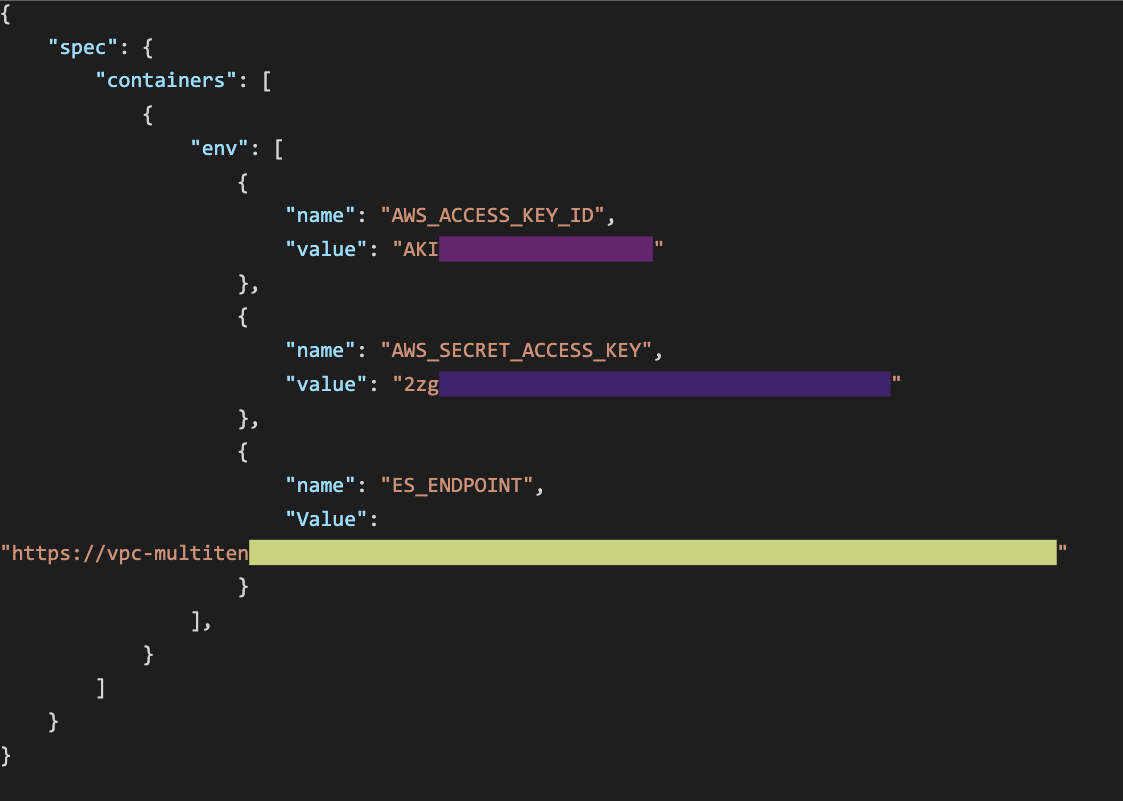
The Kubernetes service discovery mechanism (kubernetes_sd_configs) can directly expose usernames and passwords in some cases:

This discovery mechanism also exposes the last applied configuration label (_meta_kubernetes_pod_annotation_kubectl_kubernetes_io_last_applied_configuration), which can also leak sensitive information through the configured environment variables:
/api/v1/status/flags
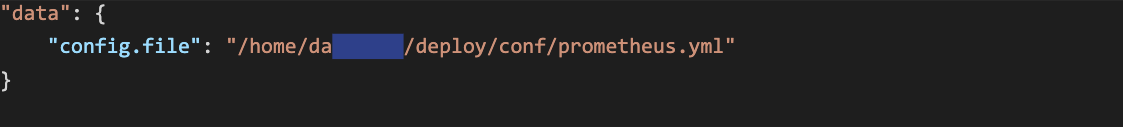
The flags endpoint provides a full path to the configuration file. If the file is stored in the home directory, it may leak a username:
Even more trouble – exposed administration interfaces
Other than the issue of sensitive data exposure due to developers’ and organizations’ non-secure deployments of Prometheus, it is important to mention an even bigger potential security issue – Prometheus provides an optional management API which can be enabled via the command line flags web.enable-admin-api and web.enable-lifecycle. These endpoints allow deletion of all saved metrics and shutting down of the monitoring server, respectively.
The endpoints are disabled by default, but in a non-secure deployment, an attacker can query the status of these settings from the API endpoint /api/v1/status/flags to check if they have been manually enabled:
{
    "status": "success",
        "data": {
            "web.enable-admin-api": "true",
            "web.enable-lifecycle": "false",
        }
}
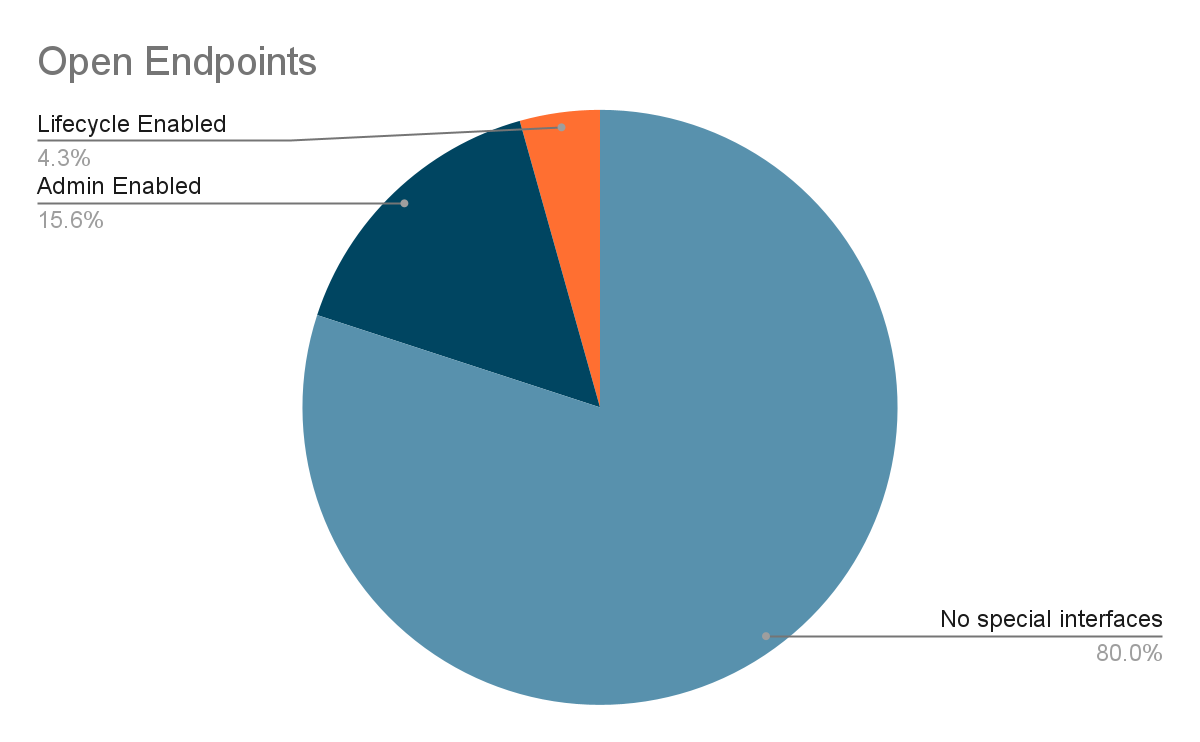
In our unauthenticated scraping effort, we discovered that ~15% of the exposed Prometheus endpoints had enabled API management, and ~4% had enabled database management. This means that right off the bat, an unauthenticated attacker can trivially shutdown and/or delete the metrics of these Prometheus endpoints. While our investigation clearly indicates this capability, to avoid harm or damage to users of those endpoints, we did not make any attempt to cause such a shutdown or a deletion as part of this research.
How to securely deploy Prometheus
As mentioned, although Prometheus did not have any built-in security features in the past, basic authentication and TLS were added in version 2.24.0. For developers and organizations deploying Prometheus, these features offer important protections to prevent sensitive data leaks as shown in the previous sections. When used together, the deployment could even be resistant to such data leaks against a local network attacker. Below, we’ve detailed the steps you can take to implement the authentication and TLS features offered in Prometheus 2.24.0 and later versions.
Enabling basic authentication
Currently, the only type of authentication supported by Prometheus is basic authentication, so let’s enable that. This will enable basic authentication both for the Web UI and all Prometheus API endpoints. First, we will need to generate a password hash using bcrypt. The easiest way to do this on Linux is by using the htpasswd tool which is available in one of the following packages (depending on your package manager) – apache2-utils, httpd-tools or apache-tools.
htpasswd can be executed as follows –
$ htpasswd -nBC 12 "" | tr -d ':\n'
New password:
Re-type new password:
$2y$12$ZcEJGmnIDSMKaeJhZsYeNukC.aJ.RhIfypct/pK5psrHEh6cB79L6
After generating the password hash, create a Prometheus web configuration YAML file (this is a different file from the standard Prometheus configuration YAML file) and add a username (ex. myuser), then the generated password hash under the basic_auth_users key:
basic_auth_users:
  myuser: $2y$12$ZcEJGmnIDSMKaeJhZsYeNukC.aJ.RhIfypct/pK5psrHEh6cB79L6
When running Prometheus, the path to this YAML should be specified with the –web.config.file command line option:
$ ./prometheus --web.config.file=web.yml
Enabling TLS
As a second step, we will enable transport-layer encryption on the Web UI and the API endpoints. This is an important task to perform, even if basic authentication is already enabled, since a local network attacker may be able to sniff the basic authentication credentials from the network traffic if it is unencrypted.
A prerequisite for enabling TLS is to generate (or use an existing) TLS certificate. Since this is a generally known procedure, we won’t elaborate on it in this blogpost. This can be easily and freely done with online certificate authorities such as Let’s Encrypt. If needed, a self-signed certificate can be generated locally, although this is unsuitable for production environments since it does not guarantee authentication and is susceptible to an SSL man-in-the-middle attack.
Assuming you have the certificate and key files, they should be copied to the machine running Prometheus and added to the aforementioned web configuration YAML file under the tls_server_config key, for example:
tls_server_config:
  cert_file: /path/to/mycert.pem
  key_file: /path/to/mykey.pem
To conclude, a proper web YAML that enables both basic authentication and TLS may look like this:
tls_server_config:
  cert_file: /path/to/mycert.pem
  key_file: /path/to/mykey.pem
basic_auth_users:
  myuser: $2y$12$ZcEJGmnIDSMKaeJhZsYeNukC.aJ.RhIfypct/pK5psrHEh6cB79L6
Conclusions
Since the advent of dynamic service discovery mechanisms and dynamic labels, it has become increasingly difficult for developers and IT services teams to track what operational data is actually exposed by Prometheus (and that data can change without notice). Therefore, we highly recommend using authentication and encryption mechanisms when deploying Prometheus to help secure against the inadvertent leakage of sensitive information. Implementing these features in Prometheus 2.24.0 and later versions is easier than ever due to the built-in support that was added by the Prometheus team in version 2.24.0 (January 2021).
In addition to enabling these mechanisms we also highly recommend anyone with a Prometheus deployment to query the endpoints that were previously mentioned, to help verify if sensitive data may have been exposed (even to authenticated users) prior to the implementation of the authentication and TLS features in Prometheus.
For production deployments requiring stronger authentication, a reverse proxy (nginx or Envoy) in front of Prometheus can provide OAuth2, SSO, or mutual TLS termination. Prometheus also now natively supports mTLS — add client_ca_file and client_auth_type: RequireAndVerifyClientCert to the tls_server_config block in the web configuration YAML.
Stay Tuned
In addition to exposing new security vulnerabilities and threats, JFrog provides developers and security teams easy access to the latest relevant information for their software with automated security scanning by JFrog Xray.
Questions? Thoughts? Contact us at research@jfrog.com for any inquiries.