Repository Log Analytics At Your Fingertips
Friday, late afternoon, and everything seems to be running smoothly. The weekend is just around the corner, so you lean back in your chair and start to plan all the fun you’re going to have. Suddenly, your phone screen lights up. An instant message from your boss that says, “Hey, some of the developers are complaining that their builds have been taking much longer than usual. Please check into it before you leave today.” “Hmmm,” you think. “Let’s have a look at Artifactory’s log.” You look at the sea of information and can’t see anything wrong. That calm smile you had on your face, anticipating the weekend, morphs into a sad frown as images of wine with friends, beer on the beach or quality time with your loved ones, dissipate into a working weekend. I have two words for you… Log Analytics.
What are Log Analytics?
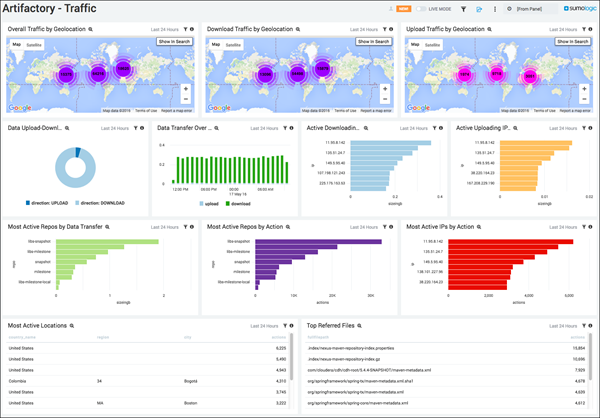
JFrog Artifactory’s latest release puts our partnerships front and center with log analytics from Sumo Logic. These are the smart people that take your unintelligible logs and machine data, and turn them into valuable insights. The Sumo Logic App for JFrog Artifactory takes your Artifactory log files and converts them into an actionable dashboard that shows things like:
- Traffic by geolocation
- Active IPs
- Most active repositories
- Most active locations and top referred files
- Denied login attempts
And a whole lot of other useful stats conveniently displayed in graphs that makes any suspicious activity instantly pop out at you.
For example, if you could easily see that those developers complaining about slow builds (or someone at their site) were also doing massive downloads at the same time, you might save yourself a wasted weekend. One of the great things about this integration is that it comes free with JFrog Artifactory v4.10. There’s an easy one-click setup to get your account with Sumo Logic established and connected, and a slew of dashboards that are built in, so you have your logs analyzed out-of-the-box as soon as you get started. Naturally, once your account is set up, you can customize your dashboard to focus on the parameters that interest you most.
Wanna hear more?
Here’s what Fred Simon, JFrog Chief Architect and Co-founder has to say about this integration.
Wanna learn more?
As it happens, we ran a webinar that goes through the integration, so please go ahead and view it.
Wanna get started?
Once you’ve upgraded to 4.10, you can follow the simple step-by-step instructions to see your first log analytics dashboards.
Unclutter Your Docker Registry
None of us like clutter in our lives. We want to keep things orderly and manageable. That goes for our drawers and cupboards at home, for our desk and also for our Docker registries. We may be able to control the socks and shirts that go into our drawers and cupboards, and the stuff that lands on our desks, but we don’t always have control over snapshots of images landing in our Docker registries. As new snapshots are built they automatically get uploaded to the local Docker registry for QA to handle, and with the pace of CI today, these can add up. If our image happens to be heavy, we not only end up with clutter but also registry bloat in our filestore. And eventually, those older snapshots become useless and unused. Wouldn’t it be great if Artifactory could automatically clean them up? Well, now it can. From this latest release, you can specify the maximum number of snapshot versions of a Docker image that Artifactory should store before deleting the oldest ones. Keeping your Docker registries clean and tidy was never easier.
What else is on the menu?
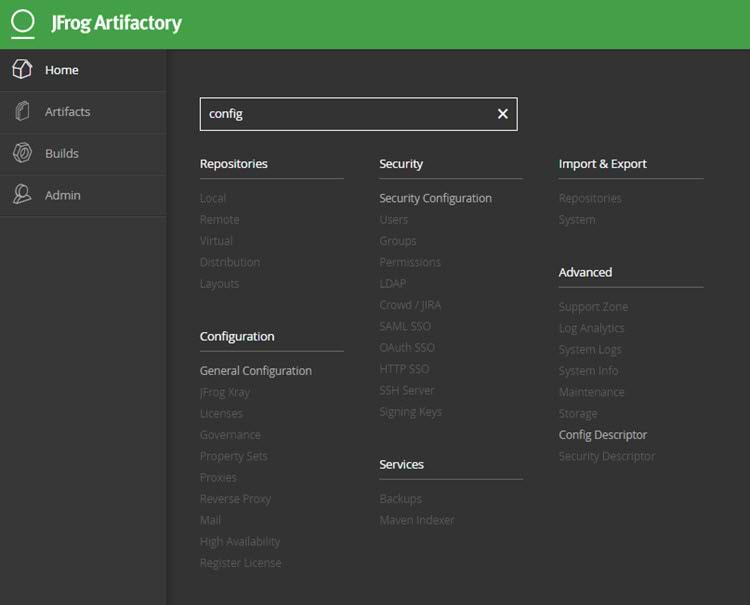
Artifactory’s Admin menu has a new look which will make it easier for you admins to…well… admin. Just hover over the Admin menu in the left navigation bar to see all the administration options you have. And if you can’t quite find something, just type it in the search box to pinpoint its location.
So if you’re ready to make your logs come alive, unclutter your Docker registries and want a smooth new menu, upgrade Artifactory now.


