Artifactory & ElasticSearch: Analyzing your Support Bundle Logs

As an administrator, one of your daily challenges is troubleshooting ongoing events according to your own predefined parameters and filters. JFrog Artifactory logs contain different entries and events according to the activities from and to the server. Tailing these logs to search for specific entries might work in some cases, but as your environment scales, you may consider other approaches. One of the efficient solutions to analyzing your JFrog Support Bundle logs, is the ELK Stack (the acronym for three open source projects: Elasticsearch, Logstash, and Kibana).
This blog post will focus on Kibana, which can run locally (using Docker) and provides basic file management capabilities that enable splitting log files while creating a predefined matrix. Among different available tools such as Splunk, Fluentd and even our native integration with Sumologic.
Kibana offers intuitive charts and reports that you can use to interactively navigate through the large amounts of log data in the Support Bundle. Moreover, ElasticSearch is super fast – which is crucial and efficient when analyzing ‘heavy’ Support Bundles.
An additional benefit to ELK is that it can be used to visualize data with charts and graphs while creating your own customized scripts and filters, according to your company policies.
Let’s see it in action!
The following example uses ‘docker-compose’ to run a multi-container Docker application, with ELK pointing to a specific Support Bundle candidate to analyze it according to our predefined filters. To achieve the desired analysis, we followed the Docker installation instructions (using version 6.7.0).
Logstash
We used Logstash, which is a server-side data processing pipeline, to ingest, transform and send the content to the ‘stash’ – Elasticsearch. In our example, the $APP_HOME/logstash_conf/pipelines directory contains configuration files (.cfg) for every log in the Support Bundle that we want to process. $APP_HOME represents the default dir location of the installation. For example, here is the .cfg file for the access.log in Artifactory:
input { pipeline { address => artifactory_access_log } }
filter {
  grok {
    match => { "message" =>
    "%{TIMESTAMP_ISO8601:datelog} \[%{DATA:status}\] %{DATA:what} for %{GREEDYDATA:[request][from]}\."
      }
      add_field => [ "received_at", "%{@timestamp}" ]
  }
}
  output {
  pipeline { send_to => elastic }
}
> Learn more about grok patterns (For example, TIMESTAMP_ISO8601, GREEDYDATA, etc..)
Filebeat & Kibana
Filebeat allows us to ship/forward the logs to Kibana. In our example, the $APP_HOME/filebeat/config directory contains .yml files for every log that we want to parse.
For example, here is the relevant part of the filebeat.yml file for the artifactory_access_log (along with other parsed logs):
filebeat.inputs:
  - type: log
  enabled: true
  paths:
    - /usr/share/filebeat/data/artifactory/access/*.log
  fields:
   service_id: "jfaccess@1234"
   log_type: artifactory_access_log
Start Analysis
Once everything is configured properly, we are ready to run the application and start our analysis. By default, Kibana is accessible over port 5601: https://localhost:5601/app/kibana
The following are some example dashboards based on common queries useful to analyze logs and troubleshoot issues.
 The dashboard in this example displays the amount of requests (request.log) per http status codes along with the username submitting the requests. In other words, this view shows users alongside the actions they performed. This indication is useful in several cases, such as identifying potential abuse or misuse against Artifactory when seeing repeated 403/401 errors.
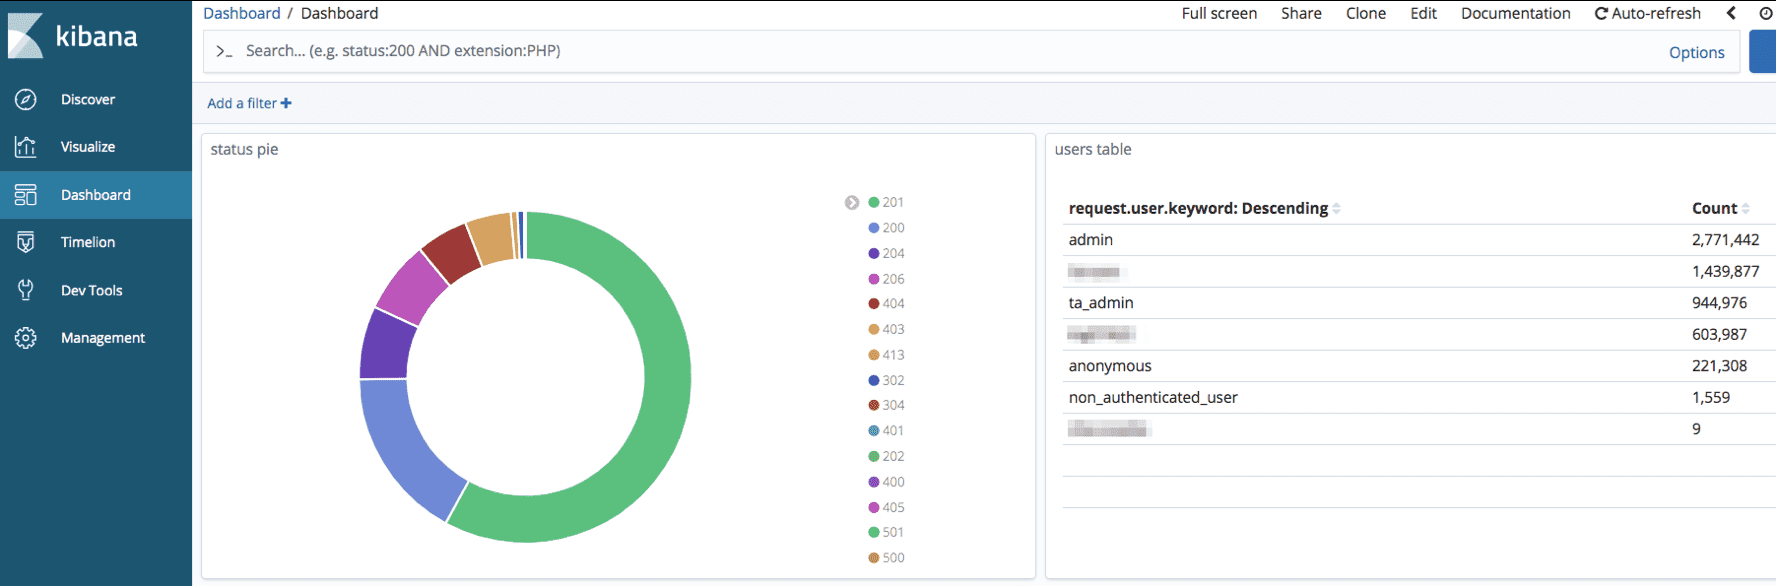
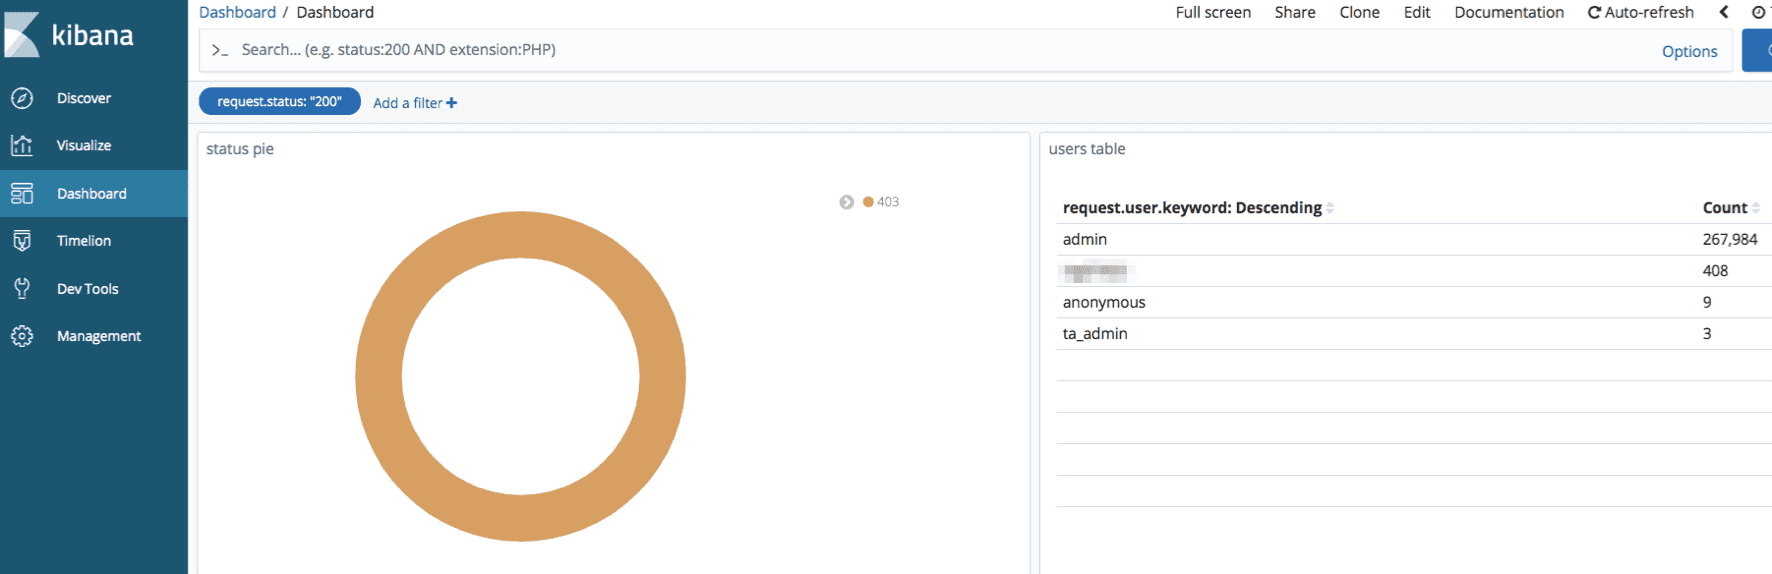
Clicking one of the http status codes will display the relevant requests/activities corresponding with the status code (for example 403).
Customizing the filters, instead of ‘tailing’ the logs manually each time a suspicious activity is happening, can save a lot of time and be much more efficient since you already have your pre-defined search params.
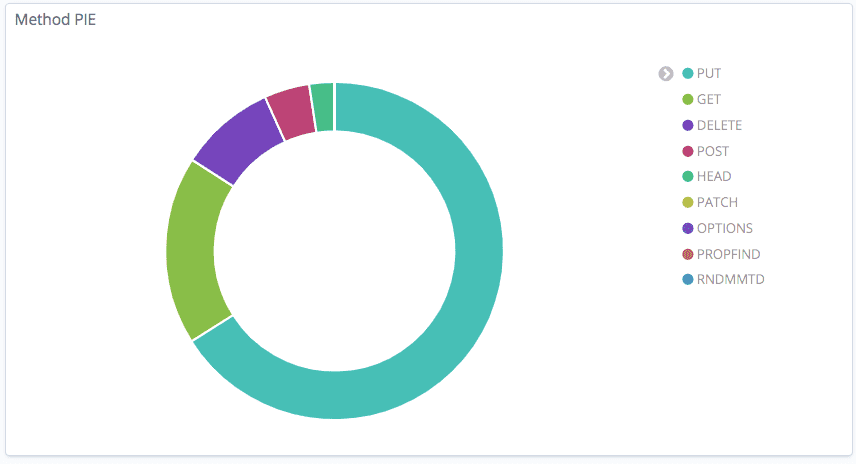
Here is an example of the Method PIE filter, which shows the methods in the request.log along with the related usernames. If you identify suspicious activity on your server which causes high CPU/MEM, the methods of requests (mostly PUT/GET), can be useful to understand the source of the problem.
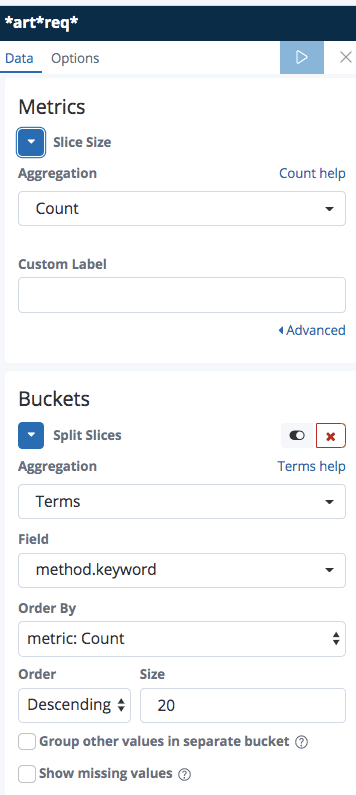
The following shows the field metrics we defined in order to present the methods from the request.log.
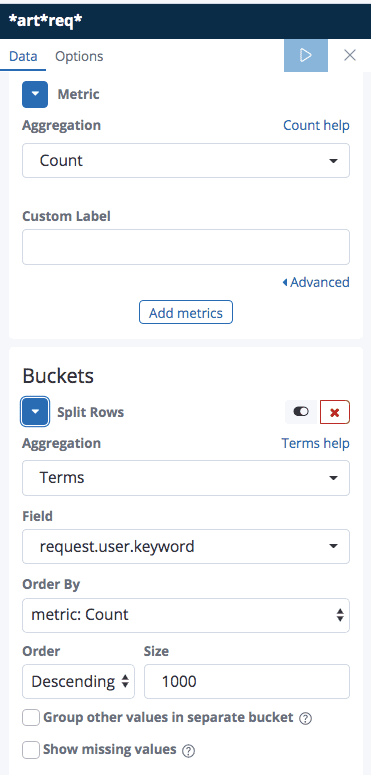
The following shows the metrics defined in order to create the requester table (Artifactory users).
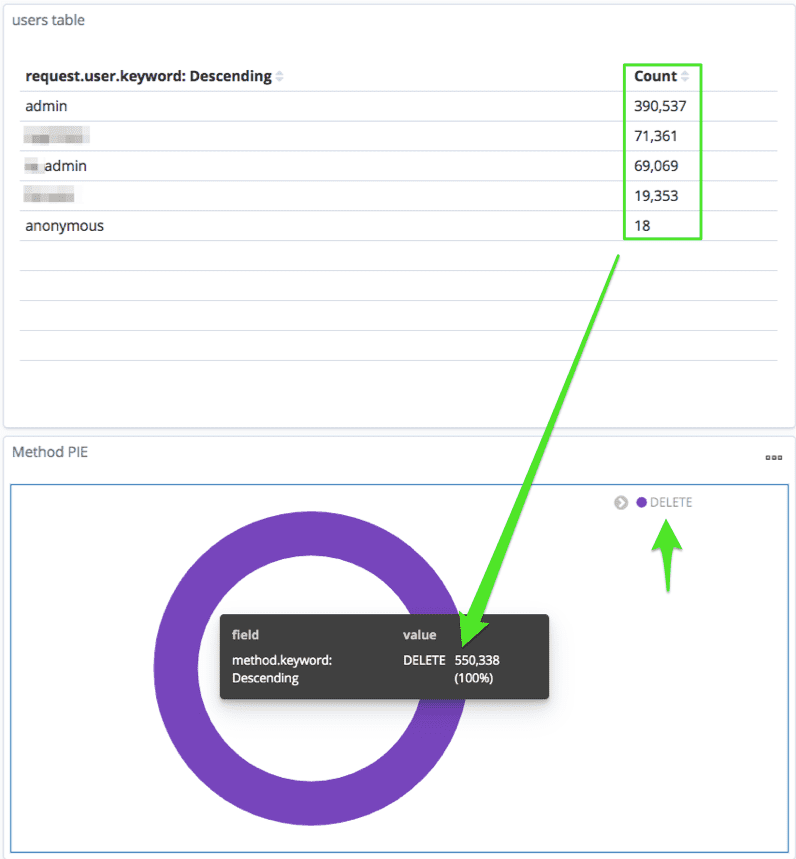
Selecting one of the methods on the Method PIE, displays the amount of requests along with the usernames related to the method in question. For example, when clicking the DELETE method, we can see the amount of requests corresponding with the users along with the count of total requests.
Suggested customizable filters when troubleshooting Artifactory
- Filter by node.id: differentiate by name when analyzing the nodes in your HA environments.
- Slowest request: view the sequence of the longest request, helpful for understanding timeouts or problematic/heavy queries against the DB.
- Include/exclude only ERROR/INFO/DEBUG from the logs: filter only ERRORs as part of your analysis.
- artifactory.log advanced filtering: customize the values appearing in the main logs according to your own criteria.
- ‘caused_by’ error groups: search for stack traces or more-informative errorst exposing code content.
This blog post covers the high-level details you need to know for analyzing your Support Bundles. This integration can also be integrated between the Support Bundles Repository and your in-house ELK. We recommend reading Elastic relevant documentation in order to understand how you can integrate between ELK and the desired content you wish to send from Artifactory.
Experience
JFrog Today
Discover how the JFrog Platform unites DevOps, DevSecOps and MLOps for secure, rapid software delivery.