Modern App Deployments: How to Use NGINX and JFrog to Automate Your Blue/Green Deployments

Modern app deployments with Kubernetes don’t have to be complicated.
Learn how JFrog and NGINX join forces to deliver consistent CI/CD deployments with integrated monitoring metrics to deliver fast, secure application experiences to your customers.
The technical demo will include examples of blue/green application deployments to Kubernetes clusters being fronted by the NGINX Plus Ingress Controller.
Video Transcript
Hello everyone, and thank you for joining me today.
My name is Damien Curry.
I am the technical director for Business Development at NGINX which is now part of F5 and today we are going to be talking about modern application deployments, especially how to use NGINX and JFrog to automate your bluegreen deployments.
Now, before we get into all of that, I like to take a few minutes and just talk a little bit about what does it mean for a modern application architecture.
Now, this may seem kind of straightforward to a lot of people but it is also something that is not fully understood by a lot of people.
To have this modern application architecture, it’s not a single solution.
There are multiple different ways and it’s not an all or nothing game, you know, you can have a modern application that is a monolith and you can have a modern application that doesn’t run in Kubernetes.
Granted, today, we’re going to be talking about more specifically Kubernetes focused, but it’s good to remember that there are a lot of moving pieces and it’s all very important but at the end of the day, these tools are here to make your life easier, to make your
application infrastructure more resilient, be able to roll out new releases of your code quickly and safely without interrupting the end user experience.
Now, there are a lot of different places where NGINX and F5 technology fits into this picture and we’re not going to spend a ton of time on that.
But we do have a whole suite of products that, you know, definitely applies and can really help you with this process.
So now while there is a lot here, we’re going to focus today, mainly on this development section of it.
Now, this probably seems pretty familiar to people who are familiar with JFrog and application development as your standard process, you know, you have a couple key pieces, you obviously have your development team who are writing the code, they then commit that code to a code repo and this is, in my opinion, probably the most important part of this architecture, it’s having that single source of truth source code repository, that everything comes from there, if it’s not in the repo, it doesn’t go into production.
And it’s just really that infrastructure is code, documentation is code.
Because that’s one of the big pieces here, where a lot of times traditionally, the code base was for the application developers only.
You know, when it came to the operations back before we had titles like DevOps and SREs and we were all just system admins and things like that.
Most of this system, I think, was managed by hand in the early days… I mean, there were some you know, maybe after a while, we got things like Puppet in Chef, which actually helped us start going down this line.
But now there are so many tools and redefining the infrastructure that’s being spun up as code.
So all of the details on how to spin up your environment in a cloud environment, it’s all in there in code. So when you do need to stand up and expand your environment, really, really quick, simple process.
The second piece that I kind of put hand in hand is this CI\CD pipeline and automation.
Obviously, it’s kind of hard to have a CI\CD pipeline without automation, and you know, they really work well together.
This is so important, especially with the pipeline side, because it allows you to have that full testing suite, you’re doing more in depth testing, before you ever get to putting it into production and you have all that level of automation to remove that level of human error, to have one less avenue to have a typo or somebody’s fat finger something or, you know, just log into the wrong server and reboot it right?
These are all things that have happened.
And you know, they’re easier to avoid now as we have this technology.
And more than anything, is the ability to roll back when there is a problem.
The number one requirement in my mind for when you’re doing a new release is having that rollback plan.
And that’s where these tools can really, really benefit your environment.
Now for what we’re going to be talking about directly today, we’re looking at JFrog’s interacting with the NGINX+ Ingress controller.
So with our Ingress controller, we’ve actually built in a lot of functionality that isn’t around in the upstream regular Ingress controller.
And mainly we introduced the idea of virtual servers and virtual server routes.
And basically this is an expanded way to have more granular control of your Ingress resources without having to turn to annotations or snippets are things like that.
So we’ve added in edit in very easy ways to go ahead and be able to be more granular with your access control, what traffic is going where and not just based on, you know, a URI or something like that and giving you that more fine grained control that you’re probably used to if you’ve been running NGINX in the past.
These SSTORIA policies that you’re able to apply at different levels.
So you can actually have your SecOps team defining policies, which are then automatically included with your other resources.
So it’s a really good way to divide and make sure that your teams are enabling each other and working together.
And then of course, you can have snippets, right?
You know, you don’t want to use them as the answer for every problem, but it’s really helpful to have that ability to go in, and the way we developed it, we broke it out. So you can have different snippets applied to many different levels of the configuration, all the way from the global HTTP variables, down to the server and all the way down to the location block.
So it is a very powerful tool that allows you to do a lot more fine grained control.
And, you know, lets you do some neat stuff like we’re about to run through here.
So now, I’m sure this process looks familiar to everybody, you know, you’ve got your basic development lifecycle, right?
You’ve got new features and bugs that come in, they generate tickets, they then get fixed, you know, then they leverage the JFrog pipelines that we’re going to talk about.
So it goes ahead and calls the pipeline, which then calls artifactory to build the image, which then calls X-Ray to check the image and make sure everything’s good.
And then finally, once all those tests pass, we get on to the deployment stage.
So first, we’re deploying in Dev, running a bunch of tests, sweet, everything looks good, let’s roll it out to production.
So a lot of people think, well, we tested it in Dev, we tested it in staging, quick, but just hit go, let’s get into production.
I usually don’t like doing it that way, right?
Because you know, even though you can do a lot of really good testing in your lower environments, it’s very important to keep in mind that there are certain features and functionalities that aren’t going to be in those lower environments, things like you know, CloudFlare like CDN, depending on what load balancers you use, and you know how that traffic is actually exposed to the public can make a big difference on how the how the service behaves.
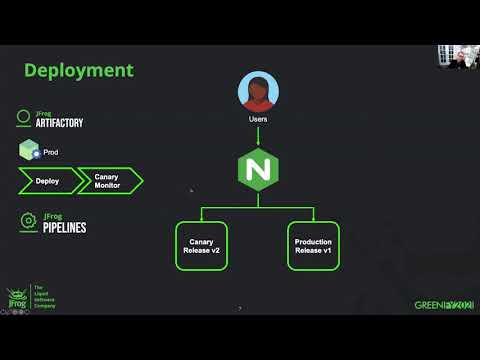
So this is where we come in with this tool. So when it comes to deployment, we have the users coming in to the NGINX Ingress controller and then from there, it’s routing it between two releases.
So what we’re running first is what we like to call a canary monitor.
And basically, what we’re doing is we’re deploying the v2 release into the production environment but we are using the functionality in the NGINX plus Ingress controller to do header matching.
So now it will only route to this v2 version if a specific header is present, in this case, header name release with the tag beta.
Now, you know, you should do that, run some quick checks. Cool, everything looks good.
Should we just flip over? Well, we could, but let’s take it a little bit easy.
So let’s go ahead and let’s use the split functionality and
let’s split the traffic between the two, watch the metrics, the return codes, see, make sure everything’s behaving properly and then we can slowly ratchet up that that ratio, and eventually get rid of the old version and move all of the traffic on to v2.
So now let’s take a look at what that actually looks like when we get into the real world.
So we’ve got our app running, we’re on build 52 right now.
So we had a bit of a change that needed to be pushed out and to fix a bug in it.
So we’re going to go ahead and make that commit, and do a git push here real quick.
And let’s see what happens.
Okay, so we pushed the codes. And now we’re going to go ahead, and let’s go ahead and sync our pipeline.
Alright, looks like that worked.
We’ve got a build waiting.
So let’s go ahead and see how the build does.
So we’ll go ahead and start at the first where we build a Docker image here with this newest version.
So first thing we got to do is just wait for the node pool to run.
So let’s see how long this will take today.
Okay, we always have the fun of when you’re running a demo live, we’ll see how long it takes this afternoon.
So hopefully this will kick the job off shortly.
While we’re at it here, we can take a quick peek at the NGINX plus
dashboard. So this is the dashboard, that will go ahead and give you some extra information about your Ingress controller exposing extra metrics, and really gives you the ability to drill down and really expose a lot.
So this one’s pretty basic right now, we just have a couple basic server zones set up our cafe example and our demo example that we’re working on today, you can see we’ve got a bit of traffic going to the cafe.
And then the nice part here is you can see how traffic to these zones is actually breaking out on the upstream.
So it really allows you to drill in, see where the traffic’s going on a per pod level even and being able to see how many requests have we gotten on this instance, you know,
what are the total requests per second, and really important for today is these error codes.
So you’re able to see a count of what the actual response codes are from a single
specific node for that upstream group.
It also has good information, you know, bytes sent received, the server checks, health check monitors aren’t being enabled at this point.
So those you’re going to see as blank, but we do have the response time.
So this is a really, really beneficial metric when you’re looking at NGINX+ because you’re able to see what is the average response time for the requests
to that upstream node.
So you’re able to better identify if you’re seeing latency or you’re seeing some issues there, you can easily tell where that latency is being added, whether it is at the NGINX level or at the application level.
Alright, so it looks like we got the build running now. So we’ll just give this a little while longer, and hopefully jumped to the next step here.
So let’s see here, we’ve got the run going, hopefully, this image will build shortly here.
We’ll be able to move on to the next steps.
So while this is running, we can actually take a quick look at what our pipelines are actually looking like here.
So we’ve got a few things. So you can see we’re defining some different resources that are required, we got access to my Git repository that has all this code in it that we are currently running, which we will go ahead and make sure we share out with everybody in case you want to take a look at this and test it out on your own.
We’re defining the image that we’re using for this application, as well as you know, figuring out some build information and some different info about the actual end point where we’ll be executing and running these pods.
Next, we’re gonna look at the processes.
Obviously, right now we’re on the Docker build process. So you can see we’re just doing a basic update, you know, pushing an image through, and then building that image, pushing it to Docker, making sure everything looks good and then promoting that into the cluster and then going ahead and actually deploying it there.
And hopefully, we can just go ahead and fast forward a little bit here and we’ll be right at the at the fun part.
Okay.
It looks like our first build has passed, step two looks like it’s all completed now.
So now we’re going to be pushing into the Docker repository.
All right.
Once they actually run, they run pretty quick but this is always the fun of doing live demos, right?
Okay, so now we’re going to be actually deploying that new pod into EKS, getting it deployed and stood up.
So again, you know, the queuing step usually takes longer than the actual execution.
So we’ll get this running real quick here.
Alright, so now we’re just making sure a namespace exists to deploy our pods into.
We’re going ahead and we’re actually making the deployment and that is all done nice and clean.
So now we’re actually getting to the fun part.
So now we’re actually going to deploy this application into the Ingress controller.
So pretty quickly here, you should see, there’ll be another… there it is right now. So there is our new deployment.
So now we can come over here, and I have in tool, I have a custom header being set.
So now if I reset this page, we should see…
And we got a 404 error. Okay, so it looks like we’ve got an issue with our new build, so
currently, right now, there’s some some checks being run in the environment right there.
We give it a couple more seconds here, it’s trying to retry, give it a few seconds, make sure that, you know, it gives it some time to make sure that that 404 error is actually an issue.
And then this test should fail pretty quickly.
And you’re going see that this is all going to get rolled back.
So in a couple seconds here, we should go ahead and see this, you know, release 54, go ahead and drop off of our dashboard as everything gets cleaned up, because that fails.
And the fun thing is you can see how simple it is to define this virtual server in Kubernetes and there’s the error. So there we go.
All cleaned up. So okay, we had that problem.
So let’s go ahead and we’re going to, we’re going to
go ahead and let’s push a new version.
So you know, somebody will say, hey, you broke everything, your version did not work properly. So let’s go ahead. Okay, we think we got a fix.
So we’re going to go ahead, and let’s push it.
Okay, we’re going to push that up to GitHub.
So now we’ll go back to the pipeline sources just to make sure we get it quickly, we’re going to go ahead and just run the sync again, I will jump back to the pipelines where you can see there is already a job processing.
Okay, so now we get to see if this build will run any faster.
And it looks like we already started a little bit quicker.
So hopefully this will be a little bit faster for us today.
And now, if we go over here, we can go ahead and refresh the page, you’ll see it now drops us back to build 52.
So that change has rolled out.
And because this was done in a header version, there was no issue seen by the public.
So it was all internal testing only even though it was in the production system.
Alright.
We went ahead and got that process done. So it’s going to go ahead and move on to the next step now and it’s successful, so that’s always good.
Okay, so we got step number two running.
And that one’s already done because, you know, once that first one happens, they all roll pretty quickly through here.
Alright, we are waiting for the Docker promote.
And here it goes.
Now it should be kicking off in a second.
Alright.
We’re going to go ahead and get this deployment actually deployed into the EKS cluster again.
Okay, great, deployment is done. And now let’s try this again.
So hopefully, we’ve caught the bug that was breaking our header check.
And so let’s redeploy it. Again, you can see, service pops
right up, you can tell here we’re setting a couple of things. So in the route definition, we’re just routing slash and so we have here, it matches the flag.
And so we’re seeing that the conditions are the header is released and the value is beta.
And that will send traffic to this demo lab service 55.
And then, every other request that doesn’t match that will go ahead and get sent to number 52.
So if we come over here, now hopefully, we’ll refresh this.
Sweet, we got 55.
So now just to be… then if we go ahead and I can just go ahead and stop…
Okay, so now this is running while these checks should pass here in just a couple seconds, everything is looking good.
We can actually bring up another tab here where we’re not setting that…
We’re not setting that value and now you can see we have number 52.
So we are having two different builds that are running on the same URI at the same time.
Okay, great. So those tests have passed and now we are moving on to splitting the traffic.
So in this demo, we’re going ahead and just doing a 50-50 split.
You know, usually in a real production environment, you would probably want to do a few more.
Alright, awesome. So that looks like it has gone ahead and ran.
Yep. Okay. And you can see that while we were running this server, it was all configured and we ran a check, and what we’re checking for here is we’re actually checking the status page on NGINX and looking for the HTTP response codes.
So you can see it found a bunch of 400 errors. So we rolled back.
Okay, so we obviously have another problem here on our hands.
So let’s go ahead, I think we got one last build and we’ll go ahead and actually fix this.
So we’re going to do our last commit and push and see what we get here.
So again, real quick, we’re going to sync the pipeline sources.
Okay, it looks like we’ve got the job running already.
Hopefully this will be our last image that we need here.
Let’s see what happens next.
Alright, so the image is built.
Let’s see how quickly the rest of the process will run this time around.
Alright, looks like this one’s running pretty good. It’s pushing the new image.
Alright, everything’s cleaned up.
We can go ahead and promote that image.
Okay, and now we’re going to push out that deployment.
There we go.
Alright, the deployment is out there and now hopefully, this will be our last time, we’ll go ahead and pass all this, all of our tests and we’ll go ahead and roll back the old version.
So again, we’re rolling out the header base test, we’ve got the new application up here.
So, let’s try it in our thing here.
So now we’ve got…
got build 56 here. And just for fun, let’s just make sure…
and we still got build 52 over here.
Okay, so everything’s looking good.
Test should hopefully be done here shortly.
Everything’s looking okay in the dashboard, you can see I’ve got a couple of requests go into the new one, and a couple of requests go into the old one.
So it is good to be able to tell that your traffic is being segregated in there and you’re not worrying about having public facing traffic hitting these early deployments.
So hopefully in a couple of seconds here, this check will go ahead and pass.
Okay, and now we’ve got the weighted deployment going and you can see all of the…
all of the counts are going to reset, this is all real time.
So you can also easily pull this data into Prometheus with our Prometheus exporter, and do the checks against that as well.
So it’s really flexible.
Okay, now you saw that. It happens really quick once it all comes together, so the checks passed, and we went ahead and not only rolled all of the traffic to the new version, we went ahead and rolled back the old version, which you can see here. So now instead of build 52, we’ve got everything run in build 56. So there we go. That’s the end of our demo here.
Hopefully everybody enjoyed the presentation.
Please let us know if you have any questions or comments.
We’d love to hear more and everybody enjoy the rest of conference and have a good day.


