MyJFrog Portal: The Solution for Managing Your JFrog Cloud Subscription
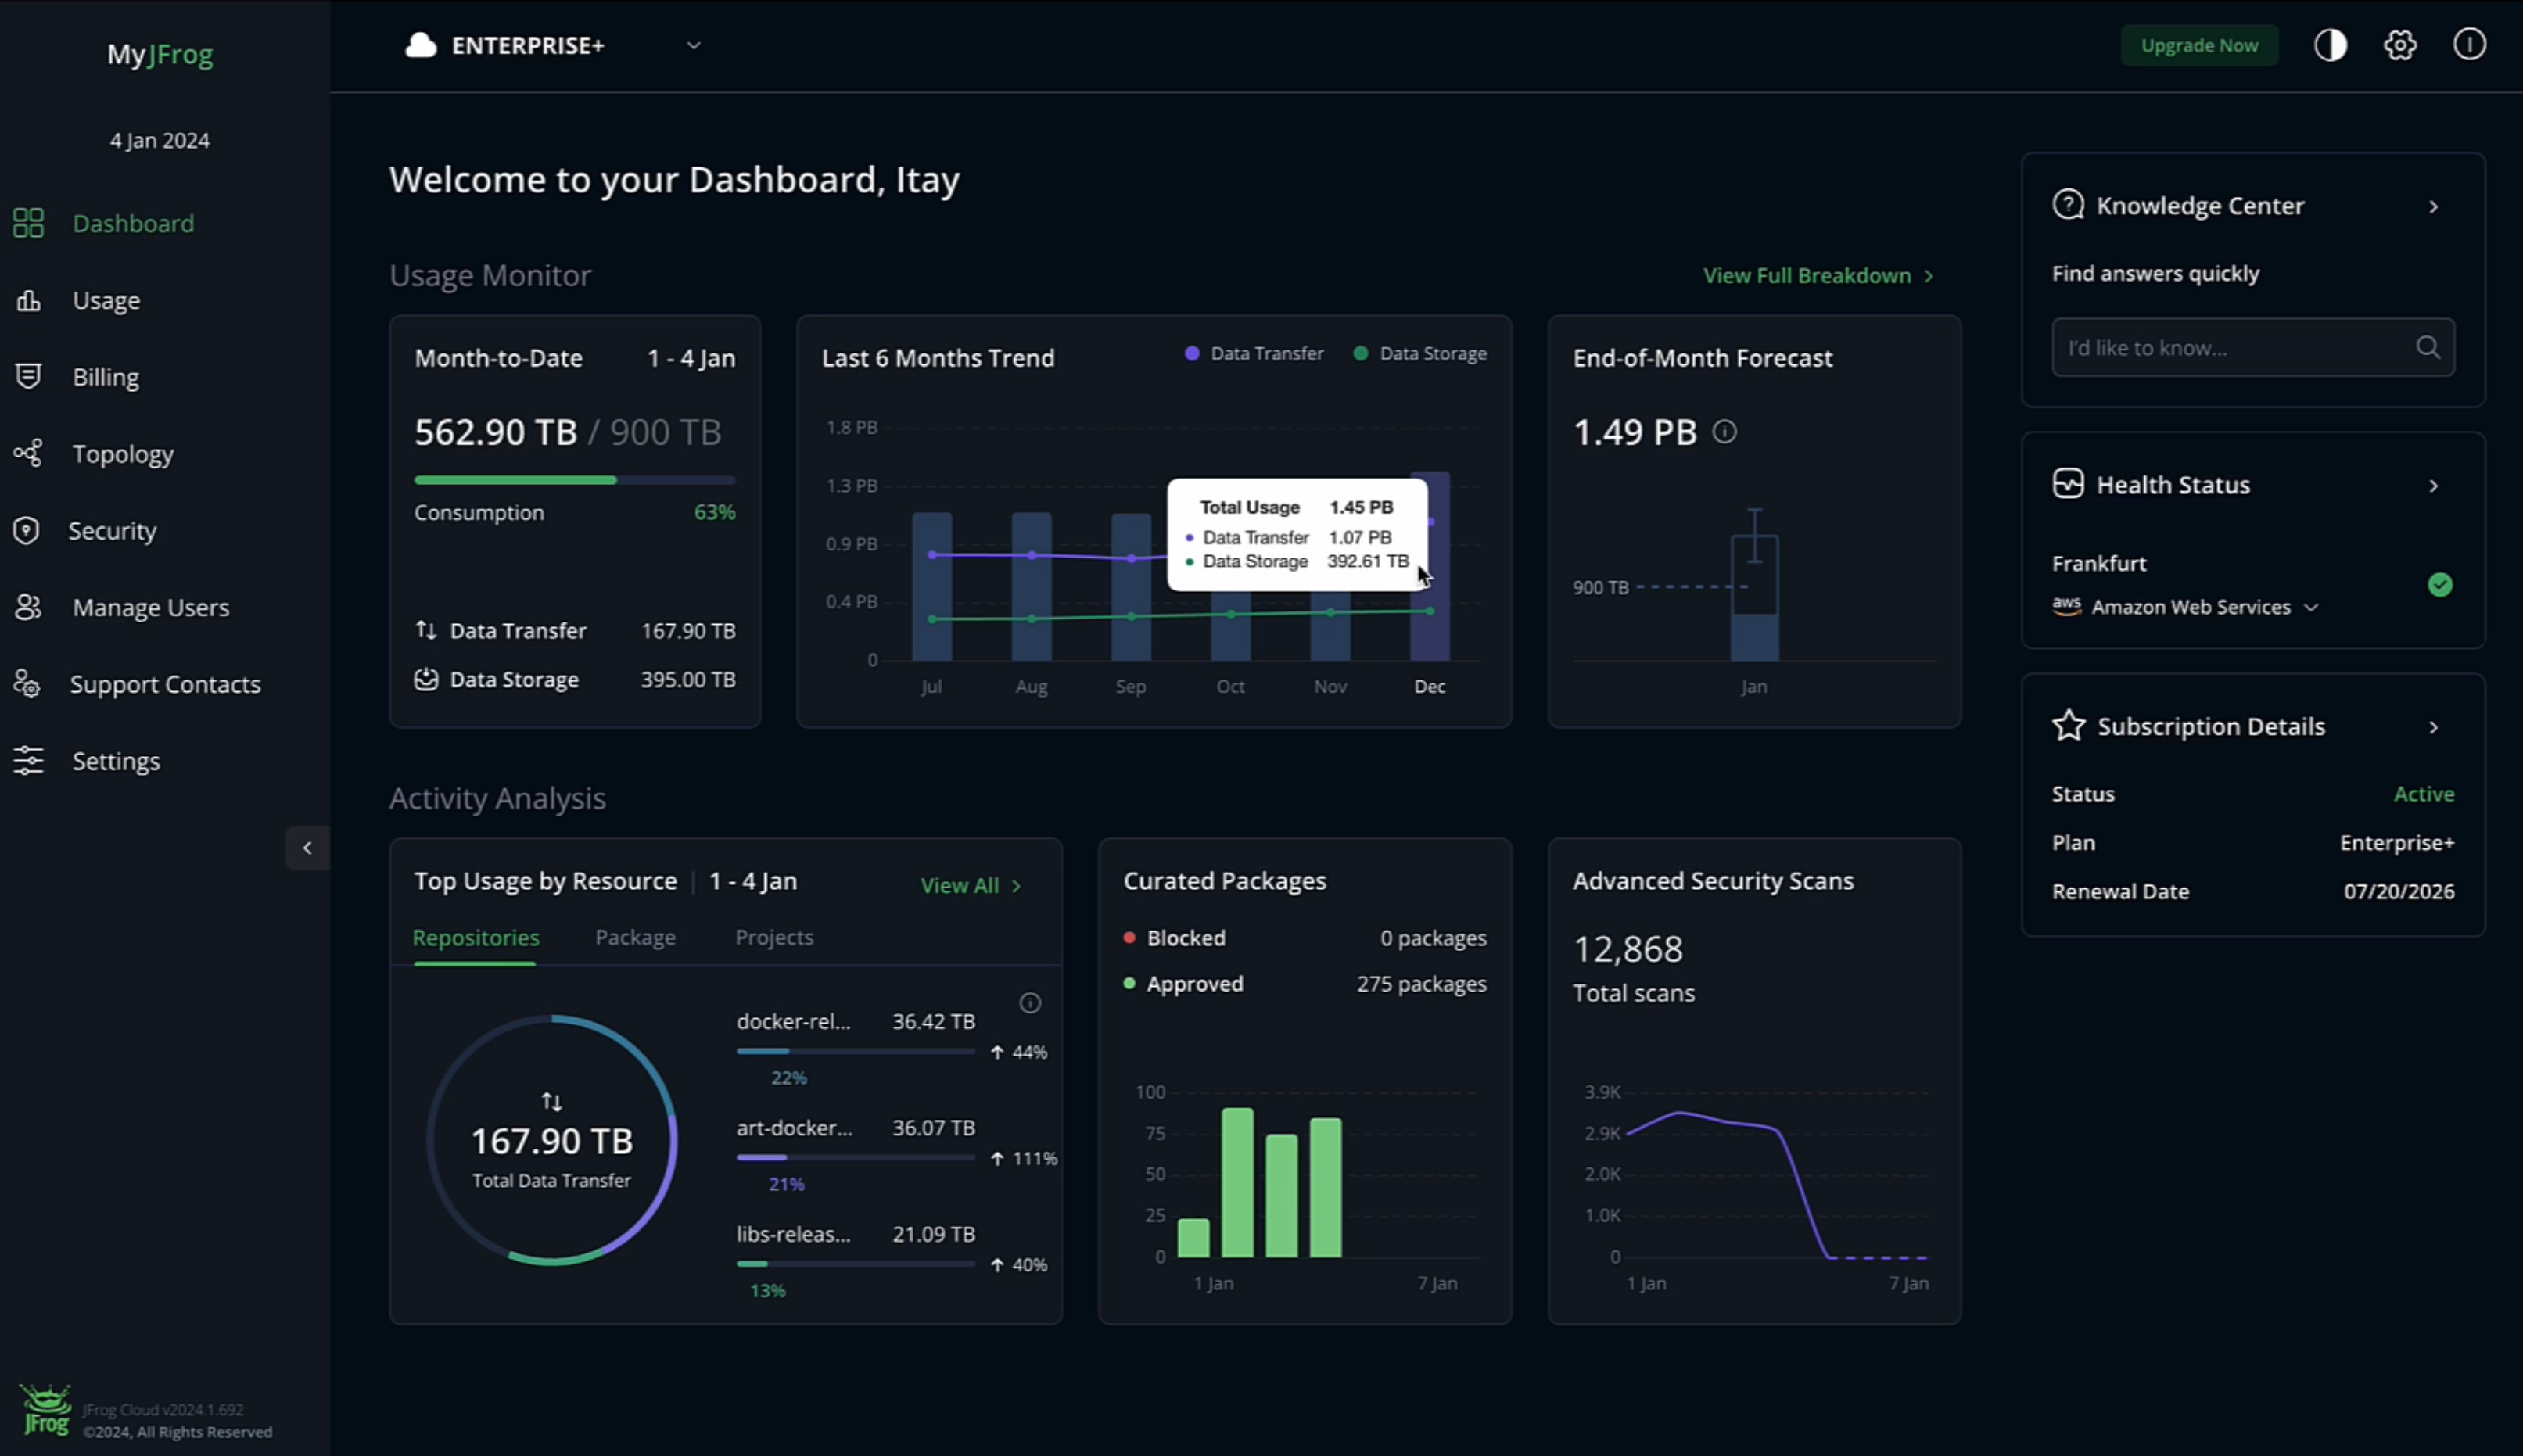
MyJFrog is a central management portal for managing your JFrog cloud subscriptions. It provides a single, centralized view to manage and monitor users, subscriptions, resources, and usage. This gives you the control, visibility, and predictability you need to make informed decisions about your environment.

If you have multiple JFrog Cloud subscriptions, MyJFrog lets you access and manage them all in one place. Here are just a few of the benefits of MyJFrog:
- Unified management dashboard: Effortlessly manage all of your JFrog products and services from one location. This saves you time and effort while granting you comprehensive monitoring and control over product usage, ongoing trends, billing, and forecasts.
- Cloud usage monitoring: Gain insights into usage based on your subscription type and services associated with your account, including data transfer, data storage, build time, and security scan information. This information can help you optimize usage and avoid overspending.
- Cloud billing: Gain comprehensive visibility into your account’s billing history and details so you can make informed budgeting decisions and optimize usage/spend.
- Subscriptions: Monitor and manage all subscriptions with the ability to modify and upgrade or add services, and even change cloud provider or region settings.
- Cloud security: Configure security-related functions for your cloud environment, including IP/CIDR allow lists, private link connections, and geo-location restrictions.
- Custom cloud resources: Customize your cloud resources. Set up a Custom Domain Name for your JPDs and easily manage your SSL certificates.
- Community resources: Get easy access to documentation, support resources, and the JFrog community. This means that you can get the help you need when you need it.
Accessing MyJFrog
From the JFrog Platform: If you are the JFrog Platform Administrator, you can login to MyJFrog using your SSO login within the platform interface.
The platform administrator can assign user roles and permissions depending on their needs. Roles include Admin, Finance Member (billing and usage), and Technical Member (network, usage, domains, tokens). Details for managing users can be found here.
From a Web Browser: To log in or sign up to MyJFrog, simply go to my.jfrog.com and click on the “Log In” or “Sign Up” link. Alternatively, from your JFrog Platform environment, click the MyJFrog link to launch the portal directly from your environment.
If you already have a MyJFrog account, enter your email address and password to log in. If you don’t have a MyJFrog account, you can create one by clicking on the “Sign Up” link. You will need to enter your name, email address, and password to create an account.
In Summary
MyJFrog is a powerful utility tool that can help you get the most out of your JFrog investment by centralizing your JFrog cloud management activities, including:
- Managing users, subscriptions, and upgrades
- Monitoring, managing, and forecasting Cloud usage
- Monitoring and managing spending and billing
- Configure security functions related to your cloud environment
- Discovering how to make the most of your resources
You can watch a short overview video of MyJFrog in action below. To learn more, check out MyJFrog documentation.
Please note that JFrog self-hosted accounts will offer a subset of features compared to its cloud-hosted counterpart due to its self-hosted nature.


