

Expanding the security frontier with JFrog Xray
How are you currently addressing the challenges of securing your software supply chain? In today’s world it’s essential to go beyond just standard security tools when safeguarding your applications from development to production? But it doesn’t need a plethora of point solutions to do that. The JFrog DevSecOps Platform can take care of it.
Expand the software security frontier and join the JFrog Product Management team, as they discuss how JFrog Xray provides intelligent supply chain security and compliance at DevOps speed. JFrog Xray is a software composition analysis (SCA) solution that scans your open source software (OSS) dependencies for security vulnerabilities and license compliance issues.
In this session, the team will dive into these security features available with JFrog Xray:
Enhanced CVE data
SBOM
Supply chain security doesn’t take a village. It takes a platform… The JFrog Platform.

Video Transcript
Hello everyone. Welcome to JFrog’s webinar. Expanding the Security Frontier with JFrog Xray. We’re excited for today’s content and we’ll talk to you about how our platform is merging the worlds of DevOps and Security. Today’s agenda, we’ll cover a few topics including Enhanced CVE data, Jira integration, and the creation of Software Bill of Materials. So without further ado, let’s get started.
Let’s start with Enhanced CVE Data. Let’s start with why this is even needed. What’s the big deal about enhanced CVE data that JFrog Xray need support? As you might probably know, one of the security products in the market today give you the CVE information, the CVE number, the risk creating, the CVSS score, and so on and so forth. But this misses a couple of important points, important information, and those are the things that I’ve listed out here on this slide. The main things are that the information about the vulnerability itself is being identified as part of this particular CVE is somehow missed. We don’t give… There’s no much information about what exactly was found. There’s also a lot of missing information about how this particular vulnerability can be exploited and if there’s already been exploited in the real world it also misses out on giving this information about the existing examples as to how this was exploited in the real world by some malicious actors.
Also, most importantly, it also gives you or doesn’t give you the alternate mitigation options. The only mitigation options that most tools give you is by giving you a new version of a particular open source package, which you can move to remediate or fix this issue. But as you can probably imagine, not every user, not every customer would be in a position to replace the version altogether. The ideal solution in that case would be to continue to use the same version, but it somehow mitigate or remediate the issue that is being impacted by the CVE that was identified. And this is exactly where the enhanced CVE data comes into play. And this is being provided by JFrog’s internal security research team.
We now have an dedicated security research team whose job is to basically do research to find out two important things. First of all, number one is to identify new CVE’s or newer liberties out there in the open source world. And number two is also to find out new information about all the existing CVE’s too. And once the team discovers and finds out all these new information, all these things get shipped out or get shared with the customers who are using Jfrog Xray.
And here’s a whole bunch of benefits that this enhanced CVE data by our research team would give to all the JFrog Xray customers or users. It’s mainly about all things that we spoke about in the previous light. It’ll give you more information about what exactly was found, what exactly is going on as with respect to the particular CVE, as well as to give you more information about the exploits, how a particular CVE can be exploited, some real world examples, and also most importantly, how this can be remediated without having to move to altogether new different version which will help you to continue to use the same version and also give you some tips or recommendations as to how you can fix this or remediate this even though you continue to use the same version of a particular open source package.
Let’s take a quick look at that on the product itself. So here is a sample scanned result of this particular docker image, version 117 on JFrog Xray. And here is the Xray tab, which is where you’ll find all the information that Xray gives you once the scans are done. And let me pick this first result out of the thousands of results that you see over here. And this is where the CVE information or the criticality information from Jfrog’s [inaudible 00:04:11] research comes into play. As you can see, this criticality is coming from our third party sources that we rely on. In addition to that, we now have another criticality or risk rating that is coming from JFrog’s security research team. And that also say’s critical here in this case as concerned with this particular CVE. And down below here is where you see a bunch of different tabs, which is where you’ll find this tab, the source tab, which is where you’ll find summary, some description, and also some information about vulnerable versions.
And all these things are coming from our third party sources. And this first tab, JFrog Research tab is where this new’s enhanced CVE information is shown to all the users. And this is what we have been speaking about from the past five or 10 minutes. And all these data is coming from our research team and which is mainly about some summary about what exactly was found, what exactly is going on over here, details which go into exact explanation as to what was found, why it was found, and what the big deal about this is. And here is a bunch of reasons as to why we think this is critical, which has been marked as here at the top. And as you can see, this has an exploit which is already published and which is already available for any potential malicious actor who would like to cause some harm for all the users who are using this particular open source package.
And also, as you can see, there’s a possibility of remote code execution as well, which is exactly why this has been marked as critical here at the top. And last, but not the least is the remediation information. And like I said, without having to move toward all new different version altogether, there’s another way in which you can remediate or fix this issue, which is by making use of this recommendation that is to not extend this particular class. And if you just follow this recommendation that we are giving you, you can continue to use the existing version, the same version that is being used right now, but you can still remediate or fix the issue that was just identified as part of this Xrays scan. This is essentially what enhanced CVE data is all about, and this is exactly how it can help you or provide some benefits or advantages and continue to use the existing piece of open source package without having to move to our all new different version altogether. Okay.
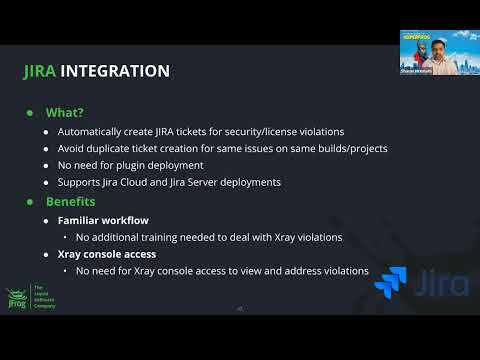
First one is the Jira integration, and then I’ll talk about as [inaudible 00:06:35] more Software Bill of Materials in a bit. As many of you know, at least to we know that 70 to 80% of our customers are using Jira as their ticketing system. And we’ve been asked about this type of integration for some time. And what we really wanted to do with this Jira integration was that we wanted to have the ability to create Jira ticket automatically based on the violations that Xray sees. And using the API integration, we are able to automatically create those Jira tickets that you would like.
The first question many of our customers have asked us is like, “Oh, is it going to create hundreds of tickets based on extra violations?” Although that’s a valid concern, you don’t need to be worried about that is because we make sure that we don’t create duplicate tickets on the same detection. For example, let’s say you have a build A that has 10 detections and we release build B in 15 minutes that also has 10 detections. We actually just create 10 tickets for those detections. You’ll not be able to see duplicates created for the same issue, for the same component.
There is no need for you to deploy your Jira plugin. I know some of the vendors like to create Jira plugins and you have to install something on the Jira server side. You don’t need to do any of that. Of course, we support both Jira Cloud as well as Jira Server, which is the on-prem department of Jira. The big benefit for our customers is that the family workflow, meaning most of the developers and DevOps team members are already used to the workflow of using Jira or ticketing system to track their work and progress and things like that. So you don’t really need to do any additional training. It basically creates a ticket based on the configurations you have configured. And you basically use your existing workflow that you have defined the [inaudible 00:08:41] are defined to deal with the extra violations.
And also in some of the very large organizations, we have noticed that not all developers have console access to Xrays. So that way they really would need to log into extra console to figure out what happened because we are including all the detection information in the ticket itself. Okay. So let’s talk about how to do this. It’s very simple. Four steps. I’ll show this as part of the demo as well. The first step obviously is to create a connection profile. What do I mean by connection profile? Here you are basically picking the authentication type you want us to use when we do the AP authentication. Jira supports OAuth1, OAuth2 and basic authentication. We will support all three of those methods. Typically, OAuth2 is used with the Jira Cloud. OAuth1 is used in some versions of Jira Server deployments.
Basic authentication is available for both Jira Cloud as well as Jira Server platform. It’s up to you to decide which type of authentication you want to use. And obviously you need the Jira Server information to login. Very simple, so you create a connection profile with the Jira URL and the API token. The second step, once you have configured the connection is to input the parameters that you would like Xray to use when creating Jira tickets. For example, you want to create tickets in certain Jira project, you want to create certain issue type. For example, you might want to say, “This is a bug,” or you can also say, “This is a security issue,” and you can create a bug type of security for example. There’s also really powerful option of creating labels automatically, labeling these tickets and that actually makes it really powerful.
For example, let’s say I want to create the CVE number as a label. So what happens is all the tickets that are created with a similar label, you’ll be able to filter and sort them and on, so on, and so forth. It makes it very easy for you to filter these tickets based on the labels and these labels sort of dynamically generated. So I’ll show you that as well. And in some cases, let’s say you have some custom Jira fields that you want to be filled based on the ticket information that we have. You can also do that so you can create custom fields and say, “Hey, fill this field with this particular information,” and we will automatically be able to fill that as well. Once you have the connection profile, once you have the configuration profile, the next thing is obviously to create an action in the rule.
So you are creating policies to detect violations. In the actions you basically are going to say, “Create a Jira ticket option.” And there’s an option to just tick checkbox. You just say, “Create Jira ticket.” And once you are done with that, you go to the watch profile and there you’re going to just select the configuration profile you did in step number two. So very straightforward. What actually this helps you is that you can have as many number of connection profiles as many number of configuration profiles you want because you might have multiple Jira projects you want to create tickets in. You have a different type of custom flows in different projects, for example, and so on, so forth. It makes it really easy for you to use any combination of, you can have one connection profile, you can have multiple configuration profiles.
It actually makes it very easy depending on a which project, where you want to create Jira tickets and with what’s the reality. Okay. Before I jump into the demo, I just wanted to show you how a typical sample ticket would look like. This is just a sample ticket that I created yesterday and I also created it some labels. So CVE automatically gets added, this is security issue gets added and this CVSS score is unknown so will just go and leave it at that. Just a quick example of how the ticket might look like when you have. Going to quickly log in.
Go to the configuration side and click on Xray and settings. You will see integrations here. The first one is Jira integration and of course the vulnerability feeds we had before we have moved them to a new tab. You can just select a new Jira integration. So integration name, authentication type that you want to choose. Just going to say it’s basic, for example. You can also say this is a Jira Server or Cloud and you just have to input the Jira URL. Very straightforward to set up the connection profile. Let’s assume that you created that connection profile, then now you have to create the configuration profile. I’ll also just quickly show you one configuration profile here that I’ve already created for my project. So profile name, the Jira project that I want to create is in BAD. And you can also see that the moment you configure a connection profile, it’ll show you all different types of project that’s already there on Jira.It automatically pulls down using the API and it’ll show you all the project that are part of Jira. And I want the issue type to be created as bug. Again, this information is available and the real power I was talking about is the different labels that you can create here. I was saying Xray violation type. I want to create Xray severity as a label as well as Xrays CVE as label, so that I’ve chosen three different built-in fields to automatically create as label. And if you scroll down, you’ll see these are all the different labels that it has actually picked up from Jira. And if any of these start with extra end score, these are dynamic labels so depending on the ticket, we actually replace those with those particular values. In case you have any custom mappings, you can add those as well.
In my project, I really don’t have any custom fields that I’ve created. So a lot would be able to add that here. But if you create any one and it’ll automatically pull down those custom Jira fields that you have created and you’ll be able to use those. For now I’m not using that. And as I was talking, one of the concerns all of us have is that will it flood Jira a lot of different tickets. You can always check this eliminated tickets by build number, by package or release bundle depending on your comfort level. We automatically suggest to you to select all of these so that we’re not creating duplicate tickets.
Step two is over. Now we have the connection profile, we have the configuration profile. The next step is basically to use this in the policies. I’ll just click on one of the policies I have here in one of the rules. I will go here and it’s basically very simple checkbox that says, “Create a Jira ticket.” So for this particular policy I’m saying, “Create a Jira ticket.” Now I’ll go back to watches. This is where everything comes together. I’m just going to click on one of these. And as you can see, I actually have the configuration profile here in the watch that basically says, “Use this configuration profile to create the Jira tickets.” So all four of these steps are required. And now basically we’ll be able to create Jira tickets for any violations that Xray sees. This is my Jira Cloud instance.
I’m just going to click on one of these. And as you can see, there are different labels created and all of the information from that Xray has. It has detail information. And again, like you can click on one of these and filter these by security for example. These are all the security labels that we have for the detections that I have. So very quick, very straightforward way to set up.
Let’s talk about Software Bill of Materials, so SBOM in Xray. This is the capability that a lot of the customers have been asking. An obvious reason is that with the Biden administration’s executive order on cyber security, they actually are managing several federal entities to make sure that they have SBOM from software vendors as they are purchasing software. The reason being obviously they would like to know if there is any new vulnerability that comes out tomorrow.
They want to easily identify which are all the software deployments that are impacted because it used to take months and they want to award that just to know if we are impacted or not, should not be taking months. That’s the big reason why Biden administration with their cyber security executive order are pushing all the different vendors that do business with the federal entities to publish SBOMs as they are purchasing.
Let’s talk about what SBOM is. It’s basically an inventory of software components and dependencies. High level. That’s essentially what it is. As a software vendor, as we sell software to federal entities, they might ask us for SBOM and we give them an SBOM in certain standard formats and we support two standard formats in disclosure, and I’ll talk about them in a bit. Of course this software list of components will include both open source and proprietary software as well.
If you think about it, there are three different personas that are part of this ecosystem of software producers, software buyers, and software operators. Software producers obviously is a persona that we are addressing with this release, we want to make sure that you understand you have an awareness of the components that are used and their core dependencies. And that’s exactly what we are going to be presenting in the SBOM in the first version. In the future versions, buyers will basically be able to get these SBOM from different vendors and they’ll be able to input those SBOM directly into the exit product and we’ll be able to scan and let you know if there are any violations for whether it is security or risk even without really having access to the software itself. And obviously the operators or other persona, every day they hear about a new vulnerability in the news and they would like to know if this new vulnerability is impacting any of their departments. And that’s the question that we are going to answer with Xray as well.
I just mentioned that there are two standards that we are going to be supporting in the current version. SPDX is now formally approved about five months ago. This got approved as a ISO standard and it is very popular with open source projects for license detection. Xray will actually support SPDX formatted SBOM in the different formats that are supported. For example, tag value, which is a text file, JSON and XLSX formats are the Microsoft Excel format. The other standard that we are going to support is CycloneDX. CycloneDX is a lightweight SBOM standard and it’s basically used in application security context. And this is also gaining popularity because it not only supports software products, it can also support software services as well. And the focus is on security. It’s not a standard yet, but it’s on the standards track and there’s a lot of contributions going on with CycloneDX and even JFrog is involved in the standard. At least in the first version you’ll be able to output the SBOM in CycloneDX format. We are going to be supporting both XML and JSON formats.
So what exactly is included in an SBOM? And this is true for both the formats that I was talking about. Obviously, we’ll show you the package name, package version, whatever licenses that we have detected. If we have URL for license, in some cases we are able to get the URL for license, we’ll be able to show that. And of course, we’ll show you the package or file checksum whenever it’s possible. Whenever we are able to calculate a checksum for a given package, we’ll be able to show that. So here is just a quick screenshot of how a typical SBOM might look like. This is from CycloneDX. It’s showing you some metadata information about the package itself, the SHA 256, hash of that, the version of that package, what type of license it is and the license you are on.
Wearing the product, you’ll be able to export SBOM. It’s very straightforward as you all know. I’ll show this in the demo as well. When you go to the extra data tab, you have actions, under that actions you will see export SBOM as SPDX or SBOM as CycloneDX. So quickly, let me jump to the demo and show that.Okay. Quickly going to go check one of the… Oops, sorry. And the actions, you can see that I have SPDX and CycloneDX. I can just select one of these and there are different formats you can actually choose to download in. Same thing for CycloneDX. Just for the sake of the demo, I’m not going to show you our text file with thousands of entries. This is very simple, very straightforward way to download an SBOM. Can I use APIs to download the SBOMs? Absolutely, yes. We do have an API, obviously it’s called US Export Component Details API. This is an existing API. We just added additional formats to that so you can be able to say that SPDX is true and you can choose which format you want and you’ll be able to download using the API, a given as form as well. So that’s pretty much what I wanted to cover.
Thanks JFrog team and thank you attendees for joining today. Please join us for upcoming webinars and workshops at jfrog.com. Thank you.