
JFrog Log Analytics with Splunk
Monitor, Investigate, and Secure Your DevOps Flow
Many enterprises rely on JFrog Artifactory, Xray, and Splunk to speed and monitor their software production life cycle through DevOps. The unified JFrog Platform provides the flexibility and scalability demanded by today’s modern software organizations to innovate and deliver ahead of the competition. Splunk’s vital data analytics platform can help optimize operational efficiency throughout the organization. People often think about the importance of monitoring their “production” services. It is equally important to monitor tools like the JFrog Platform, which are critical to the management and deployment of all the other services.
Operations teams need a way to bring disparate on-premises JFrog Platform Deployment (JPD) log data together into a single collection, to analyze performance and track down operating problems. And when even a small enterprise JPD might record millions of transaction events each day, operators need to be able to connect that data to Splunk’s powerful analytics to help find vital insights.
The integration between JFrog and Splunk makes all rich log data on data transfers, repository access, audit actions, and service errors from the JFrog Platform available for analysis within Splunk Enterprise or Splunk Cloud for visibility across the entire value stream. Together their solutions create Code-to-Cloud visibility.

Benefits of Integration
- Gain insight into the health and efficiency of the JFrog Platform
- Consolidate JFrog Platform log data from multiple high-availability instances
- Visualize operational activity of Artifactory and Xray in real time
- Identify attempts to breach security
- Optimize performance of your delivery chain
The JFrog Platform
At the heart of the JFrog Platform is JFrog Artifactory, the industry standard for universal binary repository managers. Artifactory provides end-to-end automation and management of binaries and artifacts throughout the application delivery process.
- Improves productivity across your development pipeline
- Ecosystem freedom with support for all major Cl/CD platforms and DevOps tools you already use
- Supports 25+ packages such as Conan, Debian, Docker, Go, Helm, Maven, npm, NuGet, and PyPI
- Kubernetes ready supporting containers, Docker, Helm Charts, and is your Kubernetes and Docker registry
- Full CLI and REST APls customizable to your ecosystem
JFrog Xray is a universal software composition analysis (SCA) tool that natively integrates with Artifactory, giving DevSecOps teams an easy way to proactively identify open source software vulnerabilities and license compliance violations, before they manifest in production.
- Deep recursive scanning examines all the underlying layers and dependencies of components, even those packaged in Docker images, and zip files
- Be confident with the most timely and comprehensive vulnerability intelligence VulnDB, plus other sources of vulnerabilities, license compliance, component versions
- and others
- Unprecedented visibility of your artifacts and dependencies enables Xray to provide an impact analysis of any issues discovered in your software
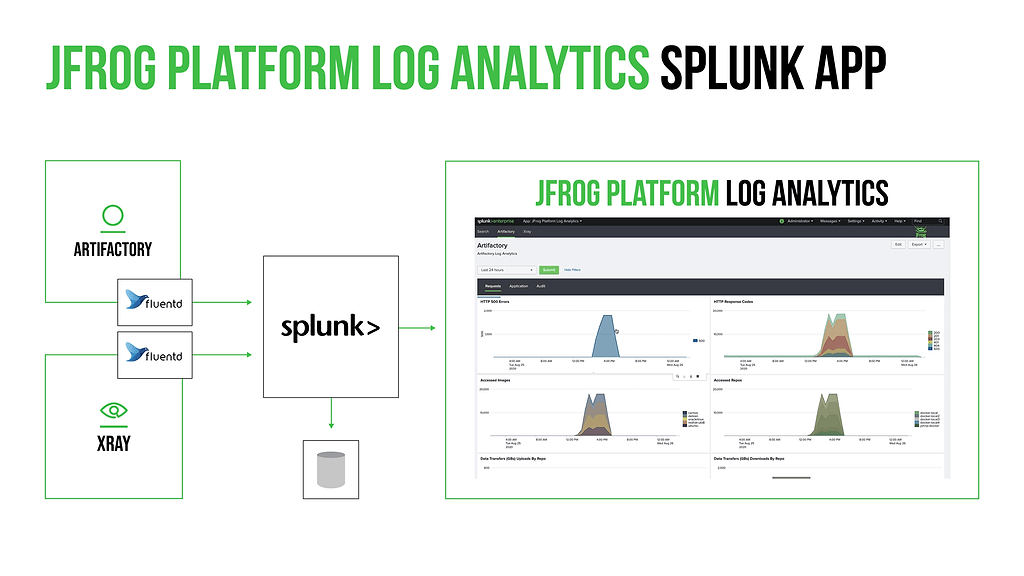
Splunk App for JFrog Platform Analytics
The Splunk App for JFrog Platform Log Analytics enables joint customers to ingest and analyze operations data from Artifactory and Xray components of the JFrog DevOps Platform. The app consolidates JFrog log information from all services and all running instances in high-availability installations of Artifactory and Xray, and presents a unified set of data through out-of-the-box dashboards in Splunk, for real-time monitoring and analytics of the JFrog Platform’s activity.
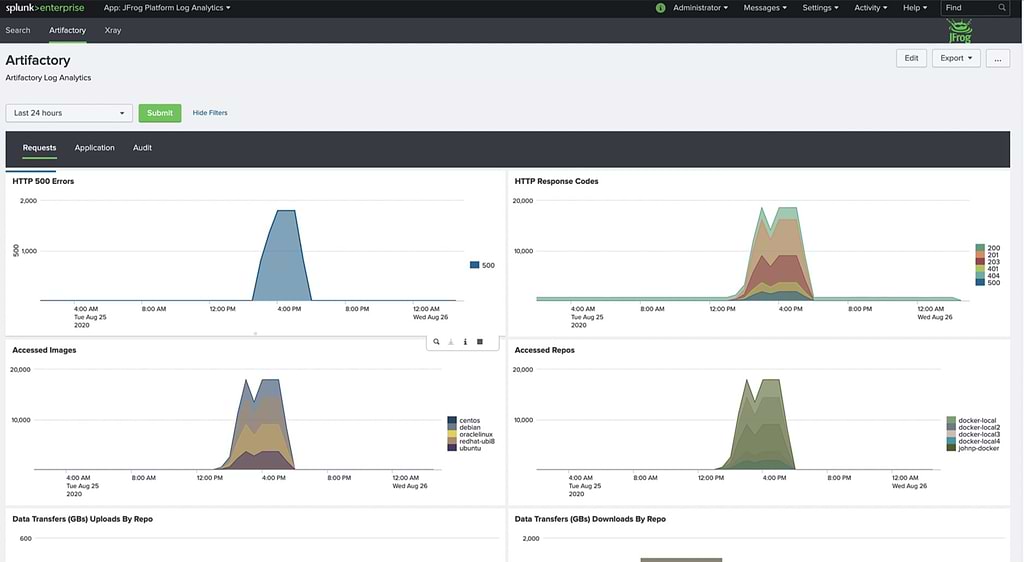
Artifactory Log Analytics
The Splunk dashboards for JFrog Artifactory log data enable you to see, in real time, what is being accessed and when. Through the Splunk visualizations, you can readily identify request inefficiencies and audit for usage and possible service attacks.
Once installed, The Splunk app dashboard presents timeline and count data for key operating metrics:
- Log volumes, which can be filtered by type
- Service errors
- HTTP response codes
- Accessed image
- Accessed repositories
- Data transfers in GB for uploads/downloads
- Top 10 IPs for upload/download
- Audit actions by username
- Denied actions and logins by IP and username
- Accepted deploys by username
If you need more, you can use the unified data to build your own custom dashboard widgets in Splunk, to gain the operating insights you need.
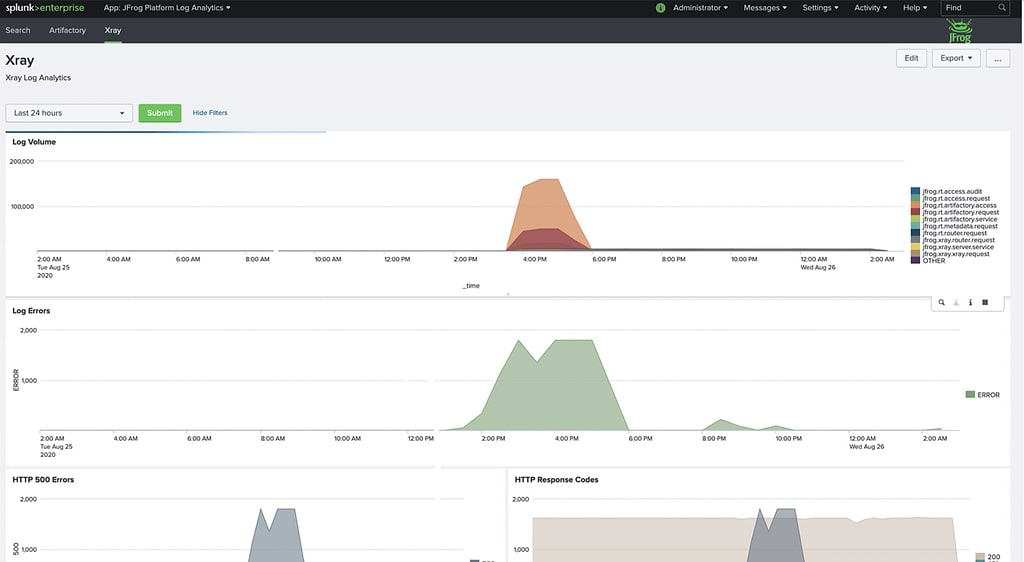
Xray Log Analytics
Through these Splunk dashboards, you can see the log activity and HTTP responses for the JFrog Xray server that scans the binaries in your Artifactory repositories for vulnerabilities. Displays include:
- Log volumes, which can be filtered by type
- Service errors
- HTTP response codes