When you ask him for the seatbelt, they say no seatbelt. And when you look in front of you, all you see is a dirt country road, how are you going to feel about driving that race car, in a dirt country road, without the tools you need to make sure that that velocity and that speed that you want to hit is successful? And that’s what this session is about.
My name is Chris Riley, I am a senior technology advocate at Splunk, which basically means I’m a bad coder turned somebody who loves to talk about software development. I’m not going to talk too much about myself. But if you want to find out more information, you can scan that QR code and it’ll get you to my socials. And if there’s anything in this session you want me to expand on, please reach out, always happy to engage, I love to hear from people who’ve seen sessions of mine. So how does it look in most organizations, if they aren’t set up for that f1 and they aren’t set up to provide their developers and their DevOps engineers and their site reliability engineers with the tools they need to go fast in a sustainable and secure way?
It’s usually driven by visibility silos. Your security professionals and your compliance professionals generally do not have visibility into what is going on with the application until it hits production. But there’s a lot that happens in the software delivery chain that impacts the quality and the security of these applications. And so creating visibility from the point that a feature is defined to the point that feature is running in production is absolutely critical.
Now, developers may be very good at creating visibility in the activity and the testing that they do. DevOps engineers, same story. And SREs tend to be really good at what happens in production. The problem with that is that if the security professionals have a question, they have to find the right person that has the answers, and they usually have to stop everything to get those answers. It’s even worse, if there’s an audit, it can stop your delivery process for weeks. So because the delivery chain is meant to ship code, the goal is that nobody needs to interrupt that process to find out what they need. And so we like to think about DevSecOps as a practice.
Yes, DevSecOps is another industry term. And many would argue that if you do DevOps correctly, you’re already considering security. But thinking about DevSecOps, as a practice takes it away from just being a tool that you expect to implement in use, and starts to think about it from a strategic perspective. And also, because it is a practice, in order to be successful, it must be visible.
What does visibility mean? It means that there is a thread that goes all the way from what happens in your delivery chain, through your infrastructure running in production, through the application layer, all the way to the users front end. And finally, your sim for security.
We call this code to cloud visibility, and code to cloud visibility is absolutely necessary to get past those silos and make sure that everybody on the organization has a good understanding of what’s happening to build more secure applications, secure the software factory and address security incidents in production. And those three are exactly the three use cases of DevSecOps practice.
Each one of these use cases has a different approach, a different set of individuals running it and a different set of technical capabilities that facilitate it. So again, it It’s building more secure applications. What are you doing to check for vulnerabilities? What are you doing to make sure that your code quality is following best practices? What are you doing to make sure that you don’t have configuration drift from development machines to production that open up the organization to risks?
Second is securing the software factory. How do you make sure that the right people are getting access to your artifacts? How do you make sure that you’re not pulling artifacts from a public repo?
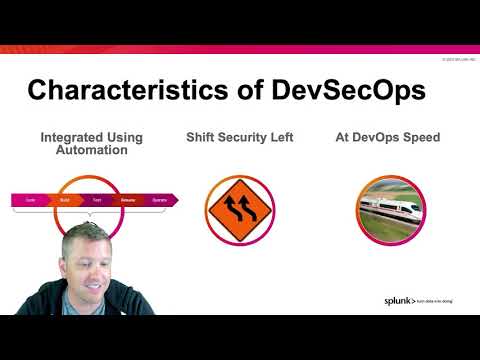
What are you doing to ensure that secrets being used are being used correctly? And finally, is the area that we’re all pretty familiar with, which is securing applications in production. But the benefit of what happens earlier in the software delivery chain is that troubleshooting incidents, security incidents in production has greater context, greater context means faster resolution, and faster root cause analysis. And the behaviors of DevSecOps are both cultural and technology. So the first thing is that automation is somewhat implied in DevSecOps, you have to think about how do you embed security in the automated testing and delivery processes of your software delivery chain, we also are moving security considerations left.
Again, it’s not just technology that moves in left, developers need to think about security, not that security becomes their job. And there’s a very strong argument to be made that you shouldn’t be making security the responsibility of developers, but giving them the tools and the mindset to know that building more secure applications, benefits everybody. And doing all of this at the speed of DevOps, the goal of DevSecOps practices, and security professionals is not to stop software delivery.
The typical security professional understands that delivering functionality to the users as quickly as possible, is key to the business. But they also know that it’s key to the business not to have to stop everything due to a vulnerability that shows up. So it’s in everybody’s best interests to build security into the development practices, and not make it an afterthought, or not make it something that only happens in production. So this practice is not one size fits all.
At a high level, we have our executives understanding that, first of all, it is a practice, it is not a technology that you go and buy and suddenly, you’re done, check the box, you have now implemented DevSecOps. Doesn’t work that way.
In each of the three use cases, we have various personas that tend to drive them. So in building more secure applications, it tends to be driven and implemented by developers and DevOps engineers, with the value being delivered to the security professionals and the SREs.
With securing the software factory, similar story, usually implemented by DevOps engineers and security professionals and sometimes Site Reliability engineers will be involved in ensuring the uptime and security of tools in the tool chain. And then finally, securing applications in production.
We’re largely familiar with driven by security professionals, supported by site reliability engineers. Just like there’s multiple personas touching the DevSecOps practice, there are multiple technical capabilities. So the prerequisite and foundation for building more secure applications and securing the software factory tends to be pipeline analytics.
What is pipeline analytics? Pipeline analytics is collecting telemetry from the tools in your tool chain, both the tools could be their logs, could be web hooks could be their API, and your automation, so the automation you run, the scripts you run, maybe it’s from terraform, or other tools you use to build your infrastructure.
Once you have that data, you visualize it in three different lenses. The first lens is operate, is it up and running? And is it up and running in a performant way?
The second lens is compliance, who is getting access to the tools in your tool chain? How are they accessing it? Is somebody using the route policy, or example? And then finally, KPIs measuring success. Also in securing the software factory, we have the sim. You can actually use the capabilities that you are used to using today in production, your sim technology on the tools and your delivery chain as well to prevent unauthorized access to these tools, and potentially expose intellectual property, and other components of the delivery chain that could impact the security of production and applications. And then finally, securing production has always been driven by Sim. But in a DevSecOps model, you also bring in the capabilities of observability to decrease the amount of time it takes to identify an incident, and give more context and incident response to help triage and mobilize people when an incident happens as quickly as possible with the right information. So let’s talk about how this comes together with Splunk and JFrog.
The two solutions are amazing partners. With JFrog Artifactory in managing the shipment and the delivery of your artifacts, and X-Ray for investigating those artifacts for known vulnerabilities.
Splunk builds visibility on top of this activity, such that you can leverage the data coming out of Artifactory and X-Ray to make intelligent decisions about what’s happening in your delivery chain right now, what might happen in the future in production, and also measure success across your entire release process. And it touches all three use cases of DevSecOps practice, both building more secure applications, securing the software factory and measuring the success of software delivery. So how does JFrog plus Splunk build more secure applications?
First of all, the visibility inside of Splunk helps you understand and know and have confidence in the coverage of XRay and Artifactory.
What do I mean by coverage? I mean you have confidence that the developers are doing what they need to do to make sure artifacts are moving efficiently and scanned for vulnerabilities. You can also leverage it to spot anomalies with artifact consumption. So who’s consuming artifacts?
When are they consuming them? From where? That behavior is critical to make sure, for example, that artifacts are not leaving the organization when they should not. Or that you’re not pulling artifacts from for example, a public repository when you should not be and you are enforcing policies associated with consuming and using artifacts.
It also supports identification of configuration drift, making sure that an artifact on a developer machine does not somehow end up in a repository consumed by the rest of the engineering team where there is a known vulnerability.
There’s also a very interesting use case where you can implement incident response in the software delivery process for vulnerabilities, you can actually have people on call, could be your DevOps engineers or your developers, when a vulnerability is spot in the build process, so that you can stop everything prior to that artifact accidentally making it in production, just bringing more attention to what is happening in the delivery process that could impact the security of the application in production.
Now securing the software factory, if you are using Artifactory and X-Ray, those are two absolutely critical tools in your software delivery process. And it is important that you make sure that the access to those tools, the uptime of those tools is appropriate. So you can check to make sure that you don’t have unauthorized access to Artifactory or some sort of denial of service attack that prevents Artifactory from doing its job and supporting the software delivery process.
You can also have a better understanding of how and when and where artifacts are being used. It could be by team, it could be by program, so that you have a baseline understanding of how your organization consumes artifacts, and start to spot anomalous behavior when it happens. And finally, we talk about measuring success.
This tends to be the area that developers get most interested in. So why is it part of a DevSecOps conversation? Well, these metrics are useful to understanding the success of the delivery chain in being indicators of problems, but also as a tool to get developers and DevOps engineers to think about security and be interested in this type of visibility. So the metrics you see on the screen right now are a part of the Dora metrics.
Dora is not the only set of metrics, but they have become a somewhat standard in the industry. There is a lot of different types of metrics out there. But these metrics help you understand the success of your delivery chain over a long period of time and organizations tend to start with change failure rate as a primary metric, both for DevSecOps, and for the development team to understand both velocity but the impact of that velocity in the value that they’re delivering to their customers. And here’s a screenshot of the tool in action.
As you can see, the add on for JFrog in Splunk is set up in the same way that I described before. It’s the three key lenses which is operate, audit, and comply. And so right now, we are looking at Artifactory and we are looking at the audit view of how Artifactory is being used and by whom. And in this view with X-Ray, we start to see the impact of vulnerabilities across the organization.
This is measuring the logs coming from X-Ray and gives you indications of the errors. Usually you’re going to have spikes during build times when you’re deploying new applications.
That’s to be expected. But it also helps you visually very quickly identify anomalies across your delivery chain, especially as a relates to detecting vulnerabilities. And finally, there is one extra use case I want to talk about.
There’s this idea of continuous verification, which is identifying vulnerabilities in code that is already shipped, where the vulnerability was not known at the time of shipping. So this idea of continuous verification is very cool.
It’s facilitated using JFrog, Splunk and other tooling from Splunk, either Splunk on call, or Splunk Phantom in order to trigger events and understanding in potentially automated remediation when JFrog identifies a vulnerability in an existing artifact, and we know that that artifact has already made it in production. So granted, this is a very cool bleeding edge use case, it requires a lot of automation and a lot of visibility to get there. And for most organizations, this is going to be a North Star to reach for. So how do you get started with JFrog in Splunk?
Well, assuming you already have Artifactory set up. If you are an existing Splunk customer, you can work with your existing instance of Splunk, but you can also go and get a free trial of Splunk to test the JFrog app out.
The JFrog app is located inside of Splunk base and the URL is right up there. Once you have your Splunk instance set up and your Artifactory instance set up, you download and install this app, you activate it and you configure it with your JFrog Artifactory instance details. Once you’ve done that, Splunk will start to ingest log data from Artifactory and X-Ray. And you will have those dashboards I showed you available for you out of the box to start maximizing the visibility across your DevSecOps environment.
So JFrog plus Splunk is your DevSecOps visibility partner.
Thank you for visiting the showcase and giving me a chance to talk to you about our joint solution. If you would like to learn any more, please reach out.
You can also visit Splunk.com to find out more information or the Splunk base JFrog app where there’s a great demo and more information on that page as well.
Thank you and enjoy the rest of the event.


