JFrog Log Analytics with Datadog
Observability of Applications from Development to Production with JFrog and Datadog
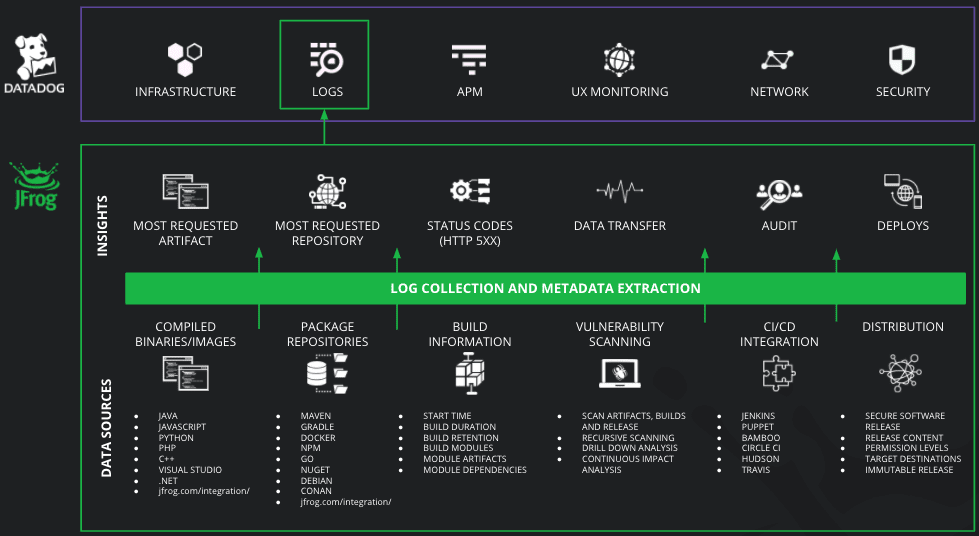
DevOps teams need a unified, real-time, end-to-end view of the software supply chain from development to production. The joint solution from JFrog and Datadog brings observability from the time that code is compiled to a binary and the build process starts to assemble the bill of materials — binaries, artifacts, dependencies and more — through testing, staging and production deployment.
By tracking and analyzing usage data with Datadog’s SaaS-based data analytics platform, DevOps teams gain granular visibility and actionable insights into their CI/CD pipelines. This helps them to continuously fine-tune their DevOps pipelines and ensure fast, seamless software releases, a key element for business competitiveness and success.
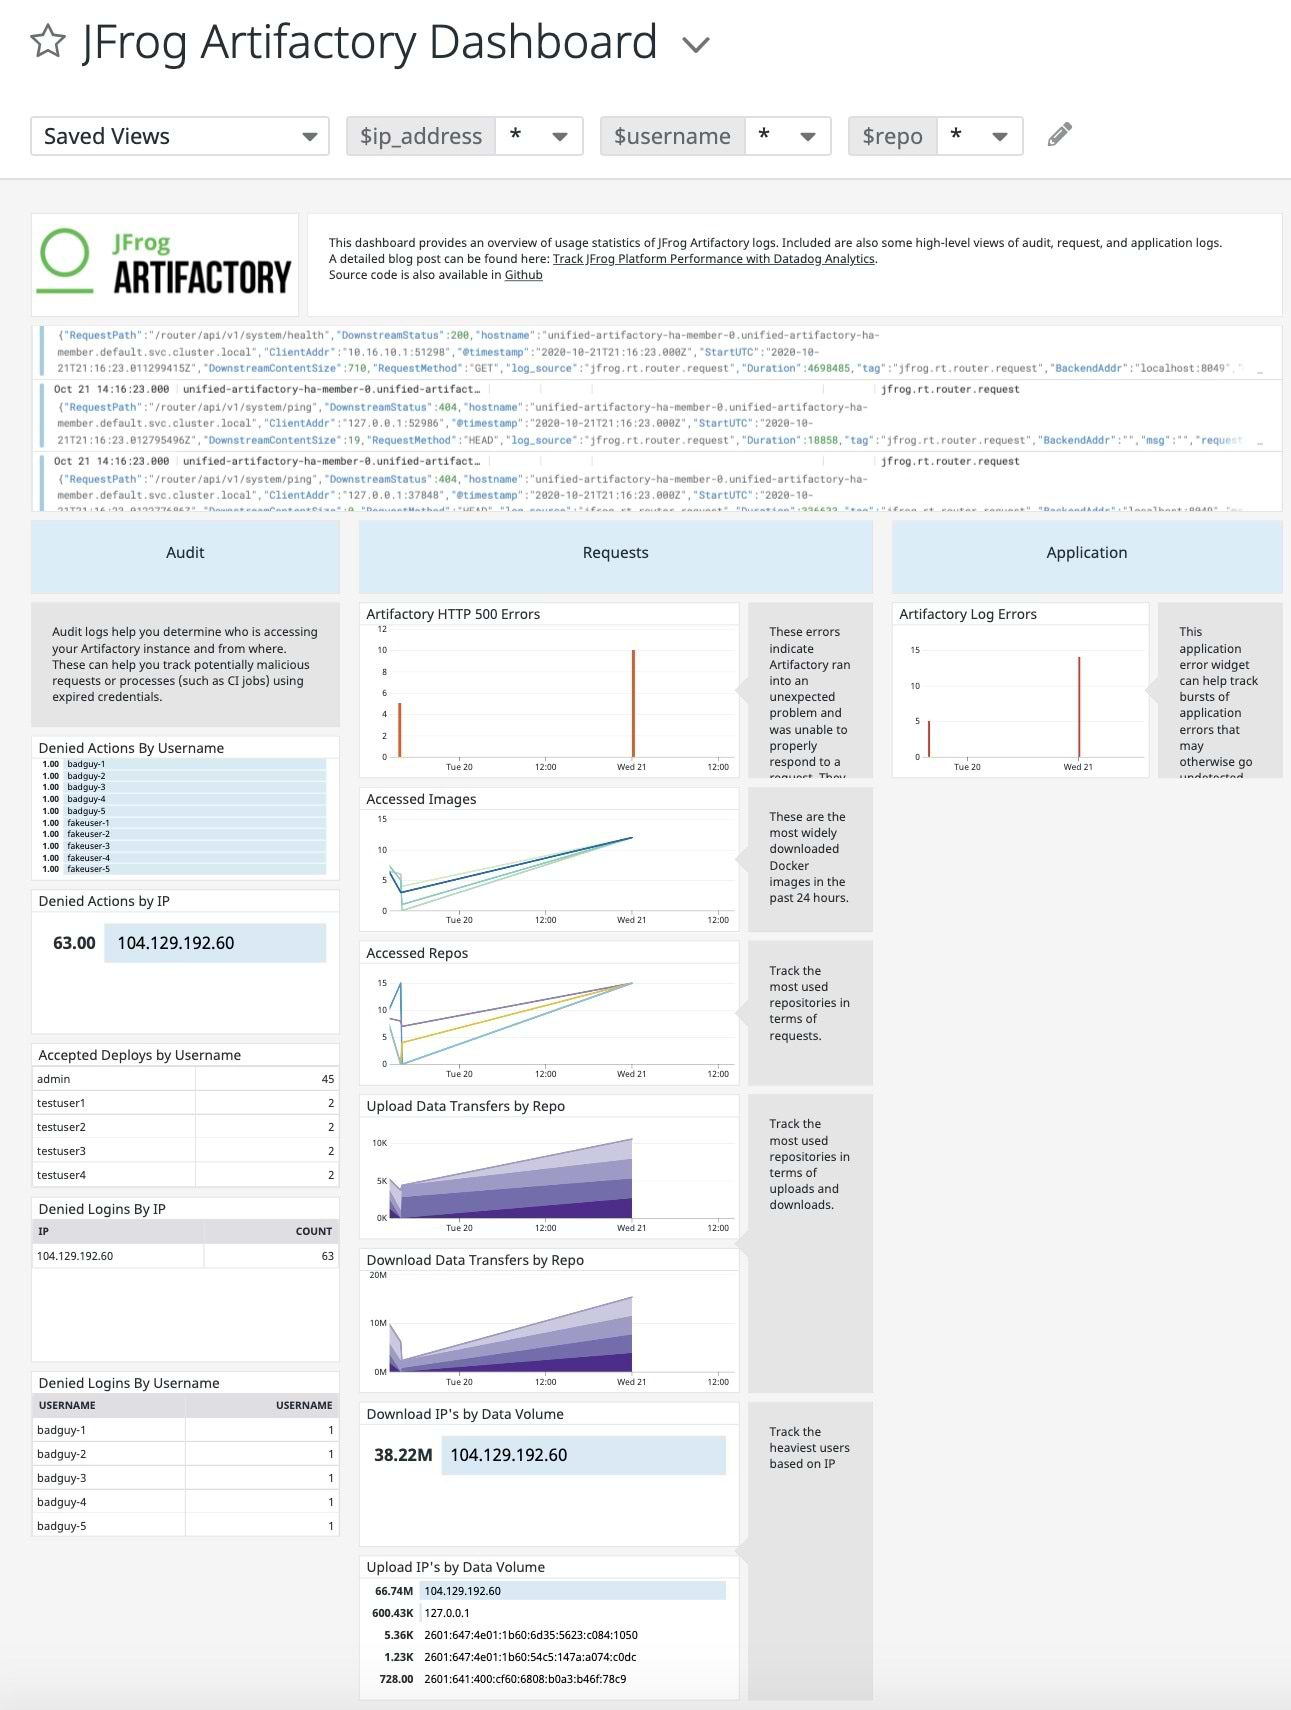
Through the Datadog dashboard, DevOps teams obtain situational awareness into the most requested artifacts and the number of deploys, and get audit logs for compliance and governance requirements. You get timeline and count data for key operating metrics, including:
- Log volumes, which can be filtered by type
- Service errors
- HTTP response codes
- Accessed image
- Accessed repositories
- Data transfers in GB for uploads/downloads
- Top 10 IPs for upload/download
- Audit actions by username
- Denied actions and logins by IP and username
- Accepted deploys by username
Benefits of Integration
- Integrated DevOps platform: See all application modules, artifacts and dependencies
- Centralized dashboard: Visualize software status, trends and changes across the SDLC
- Actionable events: Optimize the development pipeline with detailed log data
- Reproducibility of deployment build content: Isolate root cause of system events
- ‘Shift-left’: Scan software early and often for vulnerabilities and license compliance
- Operational insights: Optimize the performance of your software delivery chain
Integration Features
The joint solution provides an integrated DevOps platform with Datadog as the single dashboard for end-to-end visibility across the entire software supply chain, from code to production. SRE, Application, and DevOps teams now have a monitoring and observability solution for tracing software artifacts within each release, faster probable cause discovery, and shorter mean time to recovery (MTTR).
Datadog and JFrog deliver:
- The ability to observe the status of the release and to accelerate the pipeline through optimization of server performance, artifact replication, and distribution.
- Observability dashboard for all metrics, logs and traces across each site globally.
- Universal binary repository management for binary files, Docker images, build artifacts and dependencies for immutable releases.
- Full integration with CI/CD tools, including Jenkins, Puppet, Bamboo, Circle CI, Hudson, and Travis
- Comprehensive metadata associated with each artifact, for tracing as it progresses through the Dev and Test stages of the pipeline to provide immutable software releases in Production.
- Visibility to manage the load on popular repositories, optimize storage and see trends of deployed builds and artifacts.
- Ability to monitor and audit the actions to determine where unauthorized software access attempts originate from, and conduct enhanced forensic investigations with a complete view of software security incidents.
Use Cases
Artifact Analytics: Enterprise DevOps pipelines can serve up millions of artifacts each day. JFrog and Datadog give you actionable insights into artifacts’ status and help you understand how developers are using them.
Security and Compliance: Your software delivery must be secure and follow governance standards. With continuous security scanning of business software artifacts and component dependencies, we help you adopt a ‘shift-left’ DevSecOps strategy to detect and fix issues early and often in your SDLC.
Platform Health: Dashboards help you monitor and visualize the JFrog Platform’s health and performance metrics, and alert you to issues in real-time. Observe and correlate JFrog Platform metrics alongside infrastructure and other services with Datadog.


