End-to-End DevOps Platform As A Service with ReleaseIQ and JFrog

The line between CI and CD is blurring, and developers are looking to get end-to-end visibility from commit to production.
This can be achieved by using best-of-breed DevOps tools OR reliance on a single vendor. If you already have significant time and resource investments in using your current toolchains, it can be excruciating to rip and replace everything, sacrificing best-of-breed tools to go with a single vendor.
ReleaseIQ offers a Unified DevOps Platform as a Service which radically simplifies and provides a true end-to-end DevOps pipeline by integrating with the best-of-breed tools.
This session will cover how ReleaseIQ Platform integrates with JFrog Artifactory, JFrog Xray, and JFrog Pipelines to accelerate software releases and increase team productivity.
Video transcript
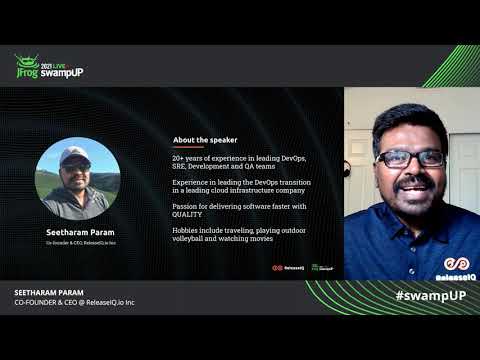
Hi, my name is Seetharam Param. I’m one of the co-founders and CEO of ReleaselQ. Today’s session is about implementing end to end DevOps platform as a service by using our ReleaselQ platform and JFrog products. Here’s the agenda, we’ll talk about myself and then we will go through our release cycle platform, we’ll talk about architecture, and differentiators and key features. And then we’ll jump to the release cycle and JFrog integration use cases. And then we’ll have the demo of those integration use cases. And then we will summarize the session.
This is about myself, I have 20+ years of experience in leading cross functional engineering teams, development, QA, DevOps, SRE. My passion has been always implementing processes to deliver software faster with quality. So you know, I have spent a lot of my career working on that exact issue. And I started the company to develop a product in that space.
I love to travel and hopefully, I can start traveling again, soon. So this is our DevOps platform. We have server which sits on the AWS cloud. And this is our agent which sits on the customer’s network, our agent is responsible to communicate with all the customers tools. And the agent can be installed on both the private and public clouds.
The communication between the agent and server is one way. And we don’t keep any confidential information in the cloud. All the confidential information will be stored in the agent. It’s a SaaS application, of course. I’m sure some of you are thinking, another CI\CD pipeline product? It’s a fair question, since there are a lot of CI\CD products out there. But wait, our ReleaselQ platform is different. Why? ReleaselQ is not just a CI\CD pipeline product. It’s an unified DevOps platform, why do we call its unified DevOps platform?
Think of any medium or large sized enterprises, they will have more than one application, that application could be new cloud native to traditional monolithic on prem apps, right? Some application will be in the journey to app modernization. So our product ReleaselQ can integrate with some of the CI\CD tools that the DevOps team already invested on for the existing applications. Also ReleaselQ platform can be used to create the CI\CD pipeline for the new cloud native applications from the scratch. So that’s why we call this a unified DevOps platform. So you feel how multiple applications, each application in a different architecture on prem, SaaS, it’s a cloud native, micro services, monolith. It doesn’t matter whether you have invested in some CI\CD tool or scripts.
You can use ReleaselQ to automate all the release process for all of those products and have one unified [inaudible]. This is the screenshot from our product, here you’re seeing a pipeline from four different products, Like ABC is an existing app product, these are brand new microservices based app, and ABC you can see we use Circle CI, 4 CI, Jenkins for CI, it comes from two different teams. And then we have CD using our product and we integrate it with these two pipelines and then we have the CD steps using ReleaselQ. The product B is bamboo and ReleaselQ product CS Jenkins and Spinnaker product B again, as I said, it’s a brand new microservices based app, you can use ReleaselQ to do both CI\CD from scratch.
You see a unified view here and we’ll see more of this in the demo. And continuous testing. So when you have a CI pipeline, almost all the tests are going to be automated in there.
When you configure the test in CI pipeline, it’s going to be an automated test. But when it comes to CD, you will have both automated and manual tests and we have the ability for DevOps admin to go and embed the automated and manual testing process into the pipelines. So not only just embedding, by doing that the all the stakeholders can see the test results.
If there is a failure, they can go and look at why it failed, debug, troubleshoot, they can do whatever they want with it. Continuous testing is part of our DNA. And we help people to actually troubleshoot the pipeline failures fast. How? We collect all the relevant logs, from all the different sources, from deploy mission, test mission, test infrastructure, deploy infrastructure, we collect all the logs, and then we apply some analytics, we provide the root cause analysis or we also give the workspace for them to go and compare the logs when the thing was a success versus when it failed.
For example, let’s say build succeeded versus failed, they can compare the two sets of logs and find out the root cause. We also provide ability for them to view all the raw logs, so they can also go and debug on their wall. When I say they, the developers, testers, whoever should debug that particular test failure. So our platform is a people centric DevOps platform, why we call people centric? Is it has value for everyone on your team.
Developers, they have that end to end visibility from commit to production, they can view the test failure, deploy failure, build failure, they can troubleshoot. QA guys, they can actually see that consolidated view of all the automated tests that they run, which test suit failed most which test cases failing most, they can troubleshoot. DevOps guys, they can see all the pipeline that they create, in one place, they can find the bottlenecks and troubleshoot the problem. Managers, we provide productivity dashboards and insights for them to improve the release efficiency. So that is something for every stakeholder in the release process.
Here’s a recap of what we talked. So our platform release cycle platform, it supports existing DevOps processes and CI\CD tool chains that you have, irrespective of which app you use, wherever you are in your DevOps journey, whatever cloudy use, whether you use on prem apps, SaaS apps, doesn’t matter, you can use ReleaselQ platform. And we, you can embed both automated and manual test results with the pipeline, we saw that and advanced troubleshooting and intelligent root cause analysis features to reduce the mttr and then it’s a people centric DevOps platform.
These are all the differentiators and key features of our product. With this, I want to jump into our JFrog integration use cases. So with our platform, when you bring JFrog products like Artifactory, X ray and JFrog pipeline, you can really implement the end to end DevOps platform as a service. By doing that, these are all the use cases that you can solve.
First use case, continuous delivery pipeline for on prem apps. Listen from JFrog Artifactory and deploy to QA environment, run the tests and deploy to UAT. So this is on prem app. And some companies even for on prem app, they have this continuous delivery process. They have this now putting our UAP environment and they continuously deliver to that environment. I have done that and it’s really really useful to do this continuous delivery for on prem apps. And you can create those pipelines using our product by integrating with JFrog Artifactory.
A second use case that you’re going to see is, let’s say you have a microservices based architecture Kubernetes service need to go all the way to production. So you don’t use any CI\CD tools in your environment right now, it’s a new product. You can use our product, all the way from listening, from GitHub, to deploying to production, especially some advanced deployment strategy, like cannery, you can do all that using our product. We, again, using Gradle, build and upload to artifactory, X ray, scan the bills using X ray, deployed to stage, run the automated and manual test, get the approval from SRE and deployed to production. So all that you can do.
Third use case, think of you have an app and again, it’s a microservices based architecture, you have two components, two services, both are different teams, they use different tools, one team use Jenkins pipeline, another team uses JFrog pipeline. In the end, they are listening, building, doing some unit testing, and then they are uploading the builds to Artifactory. And then the scan using Xray. And then you want to consume those builds, once it’s passed, you want to consume those builds and deploy to stage together. And the QA teams run some manual testing, manual and automated testing and then it goes through approval and they deploy to production. So in this case, we just use the existing Jenkins jobs to deploy.
But in the previous use case, there is no Jenkins, we use ReleaselQ product to orchestrate this pipeline. In this case, also we use Jim Jenkins and JFrog artifactory. So three use cases, continuous delivery pipeline by listening, JFrog artifactory, CI\CD pipeline from the scratch using ReleaselQ, and then to CI pipelines, external CI pipelines coming together and joining with a CD pipeline. So you can have end to end visibility. These are all the three use cases that we’re going to see in the demo.
Let me go to our product. This is swampup.releaseiq.io. So when you log in to the product, this is the admin area, and you go to settings. And this is where the… by the way that mean is going to be DevOps, right? The DevOps engineers or DevOps architect who is responsible for creating the pipeline for your applications. So they come here, they can’t figure all this out, you know, all the DevOps tools that are in your release process, they will configure here, what is a product here, I have created SwampUP product, SwampUP team and bunch of components. So they configure SCM, CI, what environment, what testing tool you use, what bug tool you use, what is a deployment tool use, what is a builder repository that you use here, we configured the Artifactory. So here not only we configure the artifactory as a tool, you can also create the web hooks from our product, JFrog web books you can create from our product.
You can actually use this web hooks directly in our pipeline when you compose the pipeline. And this is where you configure your X ray. So for our demo, today’s demo, there are a few things I want you to know. So one is we listen from some GitHub here, and we have different configures, we have x rays configured. And we don’t use deployment tool, bug management tool in our demo today.
Let me go to the pipeline composer. This is where the DevOps admin creates pipelines, and it’s a drag and drop pipelines. I’m not going to create a pipeline today, we already have created some pipelines. I’m going to go through that. So this is the first use case onprem. Listen from Artifactory. So when you drag and drop this trigger, you select build repository. This is the Artifactory configuration that we already did. This is the web hook we already created using our product, it was configured in the settings section. You basically select which web hook you want to use in this pipeline. And then how do you want to deploy, I want to deploy using my Jenkins job, here is a job it takes a parameter, it’s a file path. This file path is passed from the payload that we get from the web hook. So that’s why we need to listen.
That’s why we created that web hook, we get the payload, we get the file path, we pass that file path as a parameter to the next deploy job. And then we configure automated test. And again, it’s a J unit test and we have this concept called quality gate, you can say allow pipeline to proceed even if the tests fail, you know if you say no, it will stop when there is a failure, if you say yes, and put some failure tolerance, in this case, we put 25%, that means below 25%, it will be okay, about 25% pipeline will stop. And you can also configure manual tests here, this is how you do.
You select manual, enter manually, what is a format, this is a format we already configured. And again, quality gate in this case, even if there is a failure, we are going to stop the pipeline. And then approval step and then deploy to UAT. Same thing like we were how we did deploy to QA. Using the Jenkins job, we configure this so this is the first pipeline you created. And then you enable it. When you enable this, developers will start seeing the end to end. We’ll see that in a while. And then second pipeline is the Kubernetes service. Here we listen from the ACM internal build repository, we listen from ACM, and the build using Gradle. Here you can see we are building and we are uploading that to JFrog repository. And we are scanning using JFrog X ray. So you can do all of these things and then we listen from Artifactory. And then we deploy it to stage. In this case, we are not using Jenkins we are using our internal Deployer tool to deploy, and we are using rolling update as a strategy. And then we run automated tests. And then there is an approval step, and then we deploy it to production. In this case, we use cannery, and when we pick cannery, you can also do cannery verification.
There are three ways that you can verify your Canary deployment using our own insights, using some tests, using external insights, you can get insight from some observability tools like app dynamics and New Relic. And you can have a manual step after the cannery verification before you roll out or you can use the automatic rollout. In this case, we are doing automatic rollout.
So this is the second pipeline, again, from listening from CEM all the way to production, Canary deployment. The third pipeline is two components. One is using Jenkins pipeline, you can see this is how you import the Jenkins. So go and select your Jenkins and select the pipeline, then you will automatically see all the steps. And then you’re listening from the artifactory that Jenkins pipeline approaches to and then it’s connected to release pipeline. Second pipeline, component CI pipeline is using JFrog pipeline here.
Same way you pick the JFrog tool, and then go and pick which pipeline you want to import and you directly import and then you listen from artifactory and pipeline connector is used to connect to the release pipeline. Release pipeline is a bunch of steps to deploy to stage, run the functional tests, manual test, approval process, deploy to production.
In few minutes, you can actually configure in the settings section, you can configure all your DevOps tools, and then come and create the pipeline here. Our goal is less than 30 minutes, we want our DevOps admins, your DevOps admins to create the pipelines for your existing apps and new apps. That’s the goal here and that’s what you’re seeing here. So once the DevOps admin creates this pipeline, and then they enable it, this is the view that developer see, let me go to the sample 2 product. This is the commits view.
This is the first pipeline, listen from Artifactory all the way to UAT environment. This pipeline is currently waiting for somebody to upload the manual test results. How do you upload? You click here, you extract. I’m going to upload here. I will search for sample and test pass and then my extract and I say my test cycle is completed so I save it. So now it’s uploading the manual test results. So let’s look at the some already completed pipelines here. So this is how the completed pipeline looks.
As you can see automated tests failed, though it’s failed, we still proceed. The reason is the quality gate. And you know, let’s say, developers are looking at this, and they look at one test case is failing, and then they can click, and they can see the root cause that we show, or they can go and troubleshoot the problem on their own. So this is the failure, they can actually compare this with another successful run, two runs they can compare, we show this in a chronology order, so it’s easier for them to troubleshoot. Or they can go and look at all the logs all the relevant logs here. They themselves can go through and debug the problem. So this is the first pipeline.
Now let’s go to the second pipeline, that is the microservice pipeline, where in this case, we listen from GitHub, we build using Gradle, upload it to Artifactory, scan it using X ray, listen from that Artifactory, deploy it to stage. Now this pipeline failed, why? The automated test failed, because quality gate we said do not move forward when the test fails. That’s why it failed.
Now let’s go and look at a few other ones here. In this pipeline, it reached all the way to production. So you can see this is how it looks like when we do the cannery deployment.
Now this deployment is successful. In this case, it failed. This is how it looks like, the canary verification failed. When the canary verification failed, the rollout is not getting executed and people can go and click a button here to see all the logs on why the canary verification failed. So this is the second pipeline. The third pipeline is two components coming together, we saw the first component is using Jenkins pipeline. So this is the full end to end view of that pipeline . And then component two, it’s using JFrog pipeline. This is another you know, it’s an end to end view of that pipeline. So in this case, both automated tests and manual tests failed and it’s not moving forward because the manual test failed. So what you’re seeing is, when the DevOps admin creates those pipelines, the developers can see the execution view from from commits all the way to production. And not only the end to end visibility, they can look at the failure and they can also troubleshoot the failure. And a few other dashboards that we have, we call this QA dashboards.
We allow people, the testers to come here and look at how many test suites they are running in the pipeline, when the tests passed, when it failed, how many tests passed, how many tests failed, they can see all of that. And we have two dashboards for that. And we also have our DevOps engineers, they can see all their pipelines that they are running in their environment onprem, SaaS, applications, pipelines, any kind of pipelines, all the pipelines we show here, how many in the last seven days, how many passed, how many failed, where it passed, where it failed, where is the bottleneck… they can see all of these things. And then we have an executive summary, this is for managers. So we have some DevOps metrics, what is the deployment frequency, what is the deployment lead time, they can look at it by product, by team, by component, same thing for deployment lead time. And also we provide insights.
Since we have all the pipeline data, we run analytics, we give them some actionable insights. So for example, in this case, some approvals are taking more than 24 hours.
Now, the managers or whoever is looking at it, they can talk to that approvers and see why they are taking more time to approve, right? And same thing, this particular test suite is failing. Now they have the context on which test suite is failing. Now they can contact that tester with the context and they can have much better productive communication, and also a number of commits that happened in that timeframe.
You can also filter it based on the product, so any way you want to filter product, team, component, you can do all of those things here. Another view here, pipeline summary. This is the screenshot that I showed in the slides. So this is the consolidated view or unified view of all the products pipelines across the product team components, whatever pipeline that you have in your company, you can see all of them, how many commits that went through that pipeline, how many reached that production or destination, if it is on prem app and where there is a bottleneck, in our case, we use the SwampUP 2 product so I filtered out that SwampUP 2 product. These are all the pipelines.
As you can see this is onprem, this is a microservices pipeline, this is those two pipeline, JFrog and Jenkins pipeline coming together and gets delivered to production. So you can see all of these pipelines together in one place. And not only that, if there is a problem, you can click and see, in this case, I know 14 times it ran, 4 times it failed, you can exactly see why it failed, at what time it failed.
Now, again, whoever is looking at it, they can have a better discussion with the person who is responsible for this deployment, right? Mostly it will be DevOps person, and the managers can have a better discussion with that person. So this is our product.
Now, I will jump to the slides again. So let me summarize. So we saw our unified DevOps platforms, differentiators and key features, how it supports cloud native and traditional apps, on prem, SaaS apps. And it has no core drag and drop pipelines. It has the commit based end to end visibility, continuous testing part of the DNA and it has advanced troubleshooting to reduce the mttr. It has persona based dashboards and productivity insights to improve the release efficiency. And we also talked about how we can integrate the JFrog products, we saw how we can create a continuous delivery pipeline by integrating with Artifactory.
We saw how we can do CI\CD pipeline for Kubernetes micro service by integrating with Artifactory and the Xray. We also saw how to integrate with the Jenkins pipeline and JFrog CI pipelines and create a CD pipeline.And we also have offer for SwampUP attendees.So we are giving our premium version for 6 months for free.So you should be able to use your attendee email IDs and get this offer and once you register, we can send more details about it.
We expect you to use this offer and try to use our product and give us feedback.
Thank you so much. Bye.


