JFrog uses AI and ML internally. Our Story Revealed! @ Silicon Valley Data Science, ML, AI Platform – 2021

March 9, 2021

< 1 min read


JFrog uses AI and ML internally. Our Story Revealed!

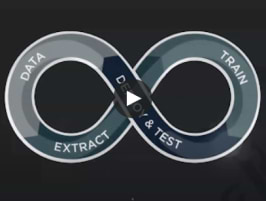
Creating a validated and secured Data Science and Model Training for an Enterprise is a challenge that many of us face. In this talk, we will discuss how JFrog applied our sense of good DevOps practices, to automate these AI and ML processes, from ideation and into deployment and production. We will explore:

  • Model-based Reasoning and Predictive Modeling, with a usable presentation of explainability data for the end-user
  • Working with Time Series Data Algorithms – our comparative study (LSTM, Facebook Prophet, Holt winters)
  • Explore the future of AI & ML for the Enterprise
View Slides Here

Speakers

Fred Simon

Co-Founder and Chief Data Scientist at JFrog

Co-founder of JFrog in 2008 (Artifactory and Bintray creator) which delivers solutions for streamlining the process of managing software artifacts in modern development, build and runtime environments. Release Fast or Die! Historically, after years of experiences on C/C++ software, I co-founded AlphaCSP in 1998 to ride the Java wave. AlphaCSP was the first BEA professional services partner in France.

Matan Mashiah

Head of Data Science

Prior to heading the data science practices at JFrog, Matan was the leader of the Artificial intelligence group at IBM’s professional services. He was responsible for developing AI and ML solutions for a variety of enterprise customers. As part of the role, he designed and implemented multiple first-of-a-kind AI solutions such as the first worldwide AI assistant via WhatsApp channel and a unique orchestration platform for supporting multiple AI assistants conversations in a single chat session. In 2017, Matan took a major part in establishing the BI & analysis platform of the Israeli national cyber security centre. He holds a MSc degree in big data and data mining.

Video Transcript

and hello everyone my name is murat i’m
stanford scientist i’m also a co-founder
of magnamine academy with basin bay area
silicon valley and
so i myself i was a particle physicist
and then become biophysicist and
bioengineer later
and i’ve been doing a lot of medicine
now i am doing fully
not fully all medicine using data
science and diagnostic devices i also
developed a diagnostic devices and i
apply machine learning deep learning
models in my technologies
and in my academy what we’ve been doing
we’re trying to
first increase the awareness for the
data science
and provide a lot of events and
activities for people
and as i mentioned earlier we have 11
000
just from the meetup groups i believe is
the more active one
and we’ve been doing online a lot of
people actually moved away from meetups
since covet because
meetups are good for the in-person
interaction
but we moved that uh we moved to online
people don’t realize that meetups can be
online too and
uh so we have online events you guys
learn from that
and all we organize over 100 events last
year
we do workshops we do different uh
different talks like that and we do also
some mini boot camps
we have a lot of free events last year
alone we hosted 16 000 people in our
events
and it is a great number 16 000 people
we give
free information and we are the most
active meetup group in bay area actual
meetup groups
activities has declined a lot and
recently
so um so please follow up uh follow us
in uh in different channels we have a
youtube channel we have recordings all
these sessions
and we have well now we are
opening a clubhouse we’re gonna have a
live more interactive session in the
clubhouse please just sign up for our
group and may if you search magnum and
clubhouse register
that and we’re gonna have a clubhouse
sessions
it will give us give you more um more
interactive
sessions and uh
you can sign up also in our meetup group
so i think most of you coming from there
um we have we are gonna we are
organizing
we haven’t launched yet we are
organizing another series of 30 minute
boot camps
it’s around the 10 12 hours lecture
series
and uh one in python one will be
in machine learning so those sessions we
give the really the basics of
that that thing python and machine
learning
it really helps a lot of people just get
started with it or just
improve themselves and that and um
we are going to launch more events we
are going to have a
data science career talks ai healthcare
talks we have
done a lot last year we are starting
again
um also if you guys are interested in
giving a talk
we have a self nomination
forum please just go ahead and just
write
all this information if you want to give
talk about anything
uh we are screening through and we just
we are happy to host you if you guys
are talking wanna talk about data
science
or anything around it and you’re welcome
to also introduce your
company and and give more technical
information about
it hope you know that as well and today
uh i would like to
[Music]
talk about our uh guest
[Music]
gas speakers uh are from
jfrog company and we have here
arie fred and mata and
i will i have actually the background
information
about fred and matan here i will talk
about that
ari you are welcome to also add yours or
also freda and matanz if i miss anything
so fred simon is the is the co-founder
chief data scientist of jfrag
uh is a maker of the database of devops
and the quarter of liquid software have
to achieve trusted continuous updates in
the devops world
uh before funding jfj fraud he
co-founded
alpha csp the joel consulting firm
in 1998 where he was the company’s
global cto
his fantastic background and his
professional development
experience goes back to 1992
and covers java technologies evolution
from day one
as a programmer architect and consultant
just you look very young for that much
achievements or you started when your
baby i’m curious
that’s a fantastic background
so matan is prior to heading to data
science practices at jfrag
matan was the leader for ai group at ibm
professional services
he was responsible for developing ai and
ml solutions for variety of enterprise
customers
as part of role he design implemented
multiple first of a
a kind ai solutions such as the first
worldwide ai
assistance via whatsapp channel a unique
orchestration platform for supporting
multiple ai
assistant conversation in a single chat
sessions
in 2019 matan took a major part in
establishing
the bi and analysis platform
of israeli national cyber security
center he also
he holds a master’s degree in big data
and data mining
that brings me you guys have really
diverse background and i was asking ari
that
why don’t you also come to call i mean
love house and people would like to
benefit from your background
and i was just promoting that we call
organized separate event and clubhouse
if you guys are interested i’m not paid
by clubhouse but i can see a very
dynamic environment
that it provides good interactive
sessions with the people
with a great background like yours
and it it it gives it also attracts the
really good people
like your background it could bring the
good dynamics so that’s why we have also
a different environment
as a magnum mining clubhouse so i don’t
want to take long and
like ari do you want to add anything to
what i said or you like to talk about a
little more
introduction before fred and matan
starts
okay sure yeah sure and uh you really
you really did get to the good you
really did get to
uh uh the great stuff that we’re gonna
be hearing a lot more about
and uh i’m honored to be here with these
great monuments
um but uh i’m ari waller and i am the
meetup event manager on the j frog
um developer relations team and we’re
really excited again to be here today
um to hear from fred and baton i know
they’ve got some a really great talk to
share
uh for for the community um i’m gonna
share a slide just really quick because
we are doing a little bit of a giveaway
um that i thought would be of uh that we
thought would be of interest um
to some people and i think it’ll also be
mentioned again
so if you don’t catch it um if you don’t
catch it this time
but uh just a little bit about about who
jfrog is
jfrog we are a devops software company
um
known best for artifactory which is
considered by many to be the gold
standard for managing your artifacts and
dependencies
we’ve been in existence for over 12
years we have 10 offices globally
and more than 3 million devops engineers
and developers use our software
tools on a daily basis uh for today
uh we have a raffle uh we’re gonna be
giving away uh ten
jfrog t-shirts and a liquid
software book we’re gonna make it a
combo so ten people are gonna win
both of those uh we have uh
also to note that fred simon is one of
the co-authors of the liquid software
book
so you can scan the qr code or i’ll drop
the bitly into the chat
um as well and um winners are going to
be selected within two
business days and we will contact you
via email uh to inform you
and then uh share it of course with the
uh uh the
your meetup page as well but uh again
thank you so much for having us today
and
um i’m going to uh close my screen so we
can get to the great stuff in the talk
marat and thank you so much again
are you welcome
hey hi guys um
so yeah like um fred simon
um and um yeah i’m
writing software since the age of 10
so that’s for the edge
um and uh since then um
like i said like i used to say trying to
make a machine
understand what i want and make it
behave correctly
uh takes a lot of time and energy uh
just
for background also in terms of
artificial intelligence and
machine learning my
first job as an internship when i went
out of school
it was in 92 was to do
a network
um a neural net to try to
classify uh and to control uh
big steel and steel factory
and um the um
improvement in ai and ml and the
improvement in
model learning since then it’s just uh
amazing and just it took us about a week
to train one model just on
the big computer it changed a lot since
then
so can you move um
yeah i can move to the next slide so um
i like to start with uh with a small job
because i think it’s
really really important for uh what um
we are trying to do here and
uh one of the main change of thinking
uh which we are seeing today so uh the
thing is that um
i don’t know how many of you know uh
what is
the three main uh
the three main secrets of french cuisine
so some of you knows what are the three
main
secrets of french creating you can raise
your hand
but basically the joke is that
the secrets are better better and better
and it’s related really well
to uh what we are doing at jfrog which
is uh devops
and uh devops automation and uh
basically the three main secret of
devops
which is the uh ability to set up a
process that enables you to release fast
to release new version faster and faster
and the three secrets of devops is
basically um you can click automate
automate and automate and everything is
about
automation everything is about how can i
actually make a machine do a lot of
what i’m doing and make it do again and
again
the same thing that what i’m doing and
so the the feedback loop here in in ai
and ml
is very interesting and and
very kind of bizarre and by the way the
developer
they had the same issue also you could
be a developer
interacting with the machine writing
code and making
a machine do uh basically what
uh what it’s programmed to do and what
it’s
supposed to do and uh still every
morning you go in you copy a file
here you cut a piece of data and and put
it on
s3 you run six commands and you do that
again and again and every morning
you just do again and again the same
thing and
uh it sounds very very bizarre that
basically we we see that we are
repeating ourselves that we are doing
the same task
again and again and we don’t
spend the time wait maybe i should
automate this stuff
and from time to time this is
um happening over and over over the
life of all software not only ai and ml
it’s uh there are some people that
decided okay i’m tired of it i’m gonna
create
a platform an open source tool this is
what happened to linux with git
to actually create a platform that helps
us
develop software faster by automating a
lot of the processes and a lot of the
things we are doing
and in the ai and
ml environment we still in a lot
of the research i mean the amount of
research to
find a good feature to do feature
engineering to
train the model correctly to find the
good parameters
there is so much research that need to
be done so much
uh manual things that need to be done
that
um we feel like we are not at the
stage or the edge of automation and
what we find out is that it’s it’s
actually not true and i i think some of
you already started to use
so what is called mlaps for machine
learning hubs but
even in ai and the environment and um
so at jfrog what we started to do is
first of all we find a great tool and a
company that is kind of helping us build
some of this
automation which is valor high so we use
the valohi.com
product to uh to help us
automate um a lot of the
model building and a lot of the research
uh environment um together so it’s
basically multiple
people and multiple data science
research operations can be done together
on the same platform
and also multiple version and this is
the main thing is that
a lot of time what we find is that you
work really hard to to clean up the data
to find the good feature to trend the
model to find the good
and you get really good um
really good number and really good
feedback from your model
and then you want to give it to
production and you put it to production
and of course one of the first thing a
lot of time that happens
is that just by putting the model in
production and matan is going to talk
about it
you actually influence the feedback the
data start to change
people start to act based on
what you are giving so it’s actually
changed the feedback loop and it’s
changed the data
so you have to retrain the model you
have to uh
find a new new parameter a new way and
so
a model is never static it needs to be
uh re-updated and and and change over
time
and you need automation
to be able to uh securely
and repeatedly uh redeploy
without having to redo a lot
a lot a lot of work and there is a lot
of manual work here that can be
automated
in this loop of data extraction training
and deployment and tests
and like i said before
this loop now is you can actually find
pattern
and this is the next stage that we want
to do with
matan and it’s it’s to actually find
pattern in the way people
are versioning any kind of software and
find pattern in the way people are
deploying and doing this loop
and this devops loop of continuous
improvement and continuous delivery
and keep doing it and so there is here
again
a feedback loop between the ai and mf
and so the
what the matan is going to present you
here is um
how we started to use this uh
methodology and this
thinking of uh keep um monitoring and
managing all kind of
parameters and
[Music]
model
to look deep into the model and how the
model
was was actually created what are the
features that are important
if there is big change for example from
one version to another
there is probably something that went
wrong and so on
so matan up to you
okay thank you very much fred and hi
everyone
so i’m going to use the next like fret
the next 20 25 minutes
uh to talk with you about two real world
use cases that we solved
and actually still solving in jfog the
first one would be
classifying the maturity of customers in
their devops journey
and basically what it means is being
able to look at one
specific customer and then classify it
classify demo journey for example if
someone is a beginner
in his death germany maybe is an
advanced user
and then based on this classification
try and see if there are any gaps
between the way that this specific
customer is using our product
so one example could be someone that is
using a very light
uh um subscription of the product but on
the other hand he is very mature
in his development journey then this
could be someone that
we might be wanting to to be talking to
and ask him
uh maybe to move to a higher tier maybe
it’s more relevant for him to
better utilize the tools that are more
relevant to his
uh uh devops status
so this is the first the first use cases
i will talk about
the second one is prediction of customer
usage patterns and alert on anomalies
and this project is basically i mean the
goal behind this project
is to be able to notify our customers
when they have uh special anomalies in
their data
when they are not using the product
properly we want to be able to to act on
it on time
and also be able to predict one two
three months ahead
um the usage of the of the uh
the usage of the product and basically
by predicting it this gives us a whole
set of options and things to do things
like um
assessing a customer health if someone
is um
having a uh for example a good trend
over time
if someone is having a negative trend if
someone suddenly has multiple anomalies
this is something that we can
use in order to improve the way that
they use the product
and eventually we’ll talk about um
deployment and monitoring aspects
meaning how we keep our models uh in
high quality
one once we put them in production so
some part of the things that i’m going
to show you are already implemented
some of them um are being worked on so
let’s begin with talking about the first
model
so the first one like i said is the
devops journey model
i’m going to start actually with the
output so what you’re seeing
uh in the right side is actually what
our
sales reps are seeing the guys from the
cells
and we basically wanted to answer the
following question
do we need to propose a customer to move
to a more advanced tool
so for example like i said if someone is
using um
a subscription of a product that is
called jfogpoix which is relatively
a medium type subscription and we know
that the devops maturity is very high
then we want to be able to uh to reflect
it to the salesperson
so this is what they will see they will
see a special field
that is populated by our model and this
field will actually tell them
that the absolute rating is high meaning
that this customer would probably need
to be
uh talking to him and ask him uh do you
want to move to the next tier based on
your usage it looks like
uh um you could be utilizing our product
better and use more features
and um basically like i said the goal
behind it
is giving the best options to our
customers based on the usage
now the second thing we provide for the
reps
which relates to what fred said is
another field that’s called
upsell feedback so let’s say for example
that we
marked this specific customer sorry
[Music]
let’s say that we marked a specific
customer as high and then there was
actually a conversation between
um the customer and the sales rep and in
this conversation conversation we found
out that the customer is completely
uh not interested so we want to be able
to to
have this feedback and improve our model
based on the feedback
and this is something that closes the
entire uh feedback loop
and allows us to improve our models all
the time but
um i think the most important thing that
we provide to ourselves
is not just the prediction not just the
the
high medium or low score for for every
customer
but we also provide them something that
we called explainability
so we don’t just give them the score we
tell them the why so
if we say hi we want to tell them why
the model decided
to classify the specific customers hi
so this is again an actual screen from
salesforce which is the system that
ourselves reps are using
you can see in the right side some
features have green color some of them
have
in this case it’s only one but red color
the red ones means these are the
features and the values
that made the model decide that this
probably needs to be
a lower maturity customer a lower
developed maturity customer the green
ones
are meaning that uh these are the ones
that pushed the model to the side that
this needs to be
a higher maturity customer
so for example in this example the fact
that this specific customer has
a very high quality of experience of
customer experience
and the number of training that he did
with the jfog is relatively high
and he uses many technologies in
comparison to
uh to other uh customers that are
similar to him
and and so on and so on for example a
bad feature could be the fact
that the number of contacts is only two
so we are only talking with two people
from this company
which is relatively low for similar
customer customers
and all of this is grouped together and
giving us the score but
it’s also giving the wrap the sales rep
the ability to have
a much more educated a much more
efficient call
with the customer so the conversation
don’t just start with
do you want to upgrade but we will see
your usage we’re seeing
uh the pattern that you’re using we can
also tell you how you
uh how you’re using in comparison to
other similar customers
and based on that we think that you
might need to consider moving
um to a better product moving into more
more features
a higher subscription um and i think
that the combination between
um the classification and the why is
actually giving us the power to
push our customers to to better use our
products
just in case you wondered in order to
produce this we use the
[Music]
package in python that’s called chap
which is very powerful and
if you’re not familiar with it i suggest
that you have a look
uh in terms of inputs of the model so
you all understand that it is a machine
learning model and
in this specific case we used cut boost
mainly because
we saw that it’s beating the other
traditional models things like
random forest and xg boost they were a
little bit
weaker in terms of performance but this
is not the only reason actually cat
boost has many
advantages so some of them is the fact
that you don’t have to deal with
labeling and missing values
most of those things are already being
taken
inside the model and these are some
example features the actual model has
100 features but some examples so we
look at the customer we look at
the website visits so if you’re visiting
in our more advanced documentation pages
versus our less advanced documentation
pages
documentation pages and we’re looking at
events that you attended webinars that
you’re attending
we’re also analyzing free text to see if
you mentioned things like
high availability um multi-site
application
things that usually relate to a higher
level of
devops journey consumption
we also look at your location we look at
the usage pattern
are you a heavy user or maybe not so
heavy user
which technologies are using how many
repositories do you have
all of this is taken into account into
the model
we’re also using some third-party uh
companies that they give us another
layer of data things like
if the company that you’re coming from
is public versus not public
how many employees you have in the
company even how many
uh devops engineer you have in your
company of course this data is never
complete
and it’s never perfect but still this is
something that you can easily
incorporate into a model and get
a pretty good uh benefit
and eventually like i said the output is
the devops maturity of the customer
and this gives us the ability to just
push customers to the right subscription
based on the
behavior now i didn’t mention it uh in
the previous slide
but one second let me okay
uh but the the list of features that
you’re seeing here is
actually being built uh specifically for
every
different customer so if this specific
customer had
this set of features it doesn’t mean
that another customer will have the same
features
it’s being uh tailored for every
customer
and we only present um 10 or
20 features per customer only the most
important ones
so the rep can really get the most
important
features and the values based on
based on shop the second model
[Music]
is a very different model this is
actually a time series model
and like i said in the beginning here
the goal was a little bit different
so let me just describe this picture a
little bit so everything you see
left to this yellow line is historical
usage this is how
a specific customer is using our product
so you can see for example that
every weekend you have those downs
and then there is usage again and then
weekend and so on and so on
and the goal is basically to try and
predict the usage for the rest of the
month
and not just one month but a few months
ahead
uh and while we do while we’re doing it
uh we notice that we can also utilize it
for more
more usages so like i mentioned for some
customers we can actually
already predict the trend the future
trend if it goes up if it goes down
and based on that we can build a company
health call so if one customer has a
very
negative trend the healthcare will
probably be negative
and this is something we can act on we
can contact the customer
we can see why things are going down and
on the other end if someone is going
going up this is also someone to talk to
and see if we can
help him to to better use our product
another thing that we are uh trying to
identify our anomalies
so for example let’s say that the red
part the red line is the prediction
right and the blue is the actual data if
we see that there is
uh a gap that is too big between the
actual
and the prediction we usually identify
it as anomaly and anomaly can have
multiple meanings
so for example this anomaly could have
the meaning that
this specific customer is going to
increase his usage and is going to
stabilize
on a new level of usage higher a higher
level
but there could be other cases as well
it could be
maybe the customer did some kind of
mistake with the product maybe he’s not
using the product properly
and causing himself to
to create a huge peak of usage while not
really utilizing the product uh
properly and this is something also that
we want to be able to track
and notify our customers on time
by the way like i said this is a time
series
model we’ve tried multiple approaches so
we’ve used lstm
implemented in pytorch we’ve used
facebook profit
and we’ve used whole printers which is a
more classical
approach feel free to write in the chat
which port you think was the most
successful out of those
three poachers lstm facebook profit or
hot winters
nobody wants to to say which one they
like
nobody has an idea okay so
i can tell you that they they don’t they
don’t want to say
which one i want on facebook
okay facebook profit
okay so actually we started with uh
withhold winters
because whole printers is i think is the
easiest out of the
out of those three um basically there
aren’t too many parameters that you can
tune
and facebook profit is uh is like a
very complicated uh i made out that
so many options to to play with and it’s
getting complicated
as you dive in lstm as well
the more used the more we we tested we
found out that
actually the traditional lstm
implementation
with a few adjustments is actually
beating facebook profit and hot printers
so this is what we chose eventually lstm
this was the winner
um and this was this was the input for
the lstm so
basically three three inputs the first
one is historical daily usage data
which is the graph that you saw for
every day
the the amount of usage
we also for every day that was that is a
holiday
we also mentioned if it’s a holiday or
not specifically
per day and also if it’s a weekend or
not a weekend
so these were the only features of the
model
and like i said the output is the
predictions
and we actually have a very accurate
prediction
uh using this lstm model
uh so now some open questions we’ve had
uh
while we started working on those models
so the first question was
which tools do we want to use in order
to build the model which data do we need
and do we have all the data that we need
what kind of verification points and
tests do we need to
to create and how we can eventually
evaluate and monitor our model over time
so regarding the tools we decided to go
with python and jupyter
mainly because python is open source uh
it’s cross-platform and in java we use
multiple platforms
it’s a high level language it means that
the code is much more readable
and sometimes also easier to to write
it can be used on multiple domains so in
python basically you have a package for
everything
unlike other languages like r which
sometimes you need to
actually enrich it with with python in
order to to get some
functionalities and in jupiter not all
of the team
is actually using jupiter this is a
flexible to choose from but
in my mind jupiter simplifies the
process of data science workforce
because it gives you the ability to
to tell a story in a notebook rather
than just writing
uh the code eventually once
once the notebook is ready you have to
convert it to uh to a python code anyway
so this is something that needs to be
taken into account
regarding the data so uh we’ve had uh
multiple data
multiple data sources that we needed to
to connect to so one example is free
text
we needed to take our emails because the
model is
looking at emails and and extracting
specific
topics from those emails so we needed to
create
continuous data flow from documented
emails which updates uh
daily the second thing is creation of
we call it point in time snapshot this
is uh
more related to the lstm model than the
first cad boost that i spoke about but
the idea behind it is to create uh data
sets
okay data sets from different time
frames and
once you have data set from the from
different times time frames you’re
actually able to test your model on
multiple time frames and multiple
configurations i will
speak about it in a second and
in order to do it we use the tool that’s
called dilation election is a tool that
gives us the ability to
create secure queries and document them
share them
write description and
move them between the team in a way that
is much more convenient than
than just managing your sql in your code
the second thing we are now working on
which is verification and tests how we
make sure that the model doesn’t fail
or giving us the wrong prediction so one
way of doing it is implementing
uh changes in futures in future
importance so future importance
is something that is not supposed to
change over time it’s not supposed to
to be to give you different results from
one run to another one
so one thing you could do is for example
track the changes if you see
that in run number one feature number
four was very important
and feature number six was relatively
low
and then when you run it one day after
or one month after
suddenly the the trend changes feature
number four is very low and feature
number six is very high
you can probably deduct that something
wrong is happening in your data and your
input data or maybe
inside your model and this is something
you want to be notified and alerted on
so this is one thing the second thing is
implementation of tests of the input
data so
usually in your modules you have
categorial data or numerical data
so for the categorial data you want to
make sure that the number of categories
and even the categories itself yourself
is not something that is changing from
one run to another
for numeric data you can track things
like uh
the mean of the distribution and the
standard deviation of the distribution
and if you see that
the changes are too uh radical from one
run to another
this is something that you also need to
be alerted on
of course this needs to be adjusted to
your data so for example if you have a
feature that is
the age of your customers you should
expect that the the median
will move from one from one one to
another
but in many other cases the mean should
be uh
steady and if you see a change you
should be elected on it
evaluation and validation so how do we
compare different configurations
so uh this again applies mostly for the
lstm
we did it mostly for the lstm we we have
used
the tool that’s called valohi and this
tool is giving us
the ability to run a grid search on
multiple parameters on multiple
uh data snapshots that i spoke before
the
different time frames of data
so eventually you have let’s say four or
five different
sets of data from different time frames
and for every one of them you can run
your grid search with multiple
parameters and for every configuration
like this you get
all of your measures things like
accuracy recall and precision
and this gives you the best uh the best
picture of
which configuration is best of for your
model but the good thing about valoi
is that it gives you the ability to
document everything
to share it with the team and also be
able to
to actually open the execution and see
exactly
what the notebook looked like the day
you’re in it with the data and
everything
so this is a very big advantage using
value i
the fact that you can document
everything everything is shared and
everything can be
reproduced because you know sometimes
you want to maximize a specific measure
for your model
it could be that one day you wanted to
to maximize your recall
and you had the fixed value of precision
but something in the business happened
and suddenly you need to adjust
the level of your recall or the level of
your precision so
you don’t need to run again everything
you can just come back to valohi
and see the different results and just
choose a different configuration that
better fits to your
new business needs so this is really
powerful and something that
we are now extending the use
lastly deployment and monitoring so in
terms of deployment
in most cases our models are running on
a batch process which is scheduled
timing twice a day on strategic hours so
strategic hours means that
we’re trying to to time the the
training and the running of the model
before the day starts
so the business will have the most
updated data but we also do it in the
middle of the day because
we want to give them the updates during
the day itself
every time we we run the model we
retrain it again
on new data so like i said twice a day
it’s being retrained
in terms of monitoring the users can
actually see
we always provide the users the entire
history and trend of our predictions
so for example if i go back to the first
cat boost model
where we give them the devops journey
score
if it’s low high or medium they can
always see
the history they can know that for
example two months ago
the journey that this specific customer
was high in his journey
and then he moved down to maybe medium
and then he moved down
one month after too low and this is
something that they can
deduct from and they can decide how they
want to tackle it and maybe
uh check with the customer why um
why they see a decline in the usage or
an increase in the usage
the second thing is deviations from the
measure that
you’re trying to maximize so if your
model has a specific
set of performance specific accuracy
recall precision f1 scroll
or whatever you’re trying to maximize
and then suddenly
you have a big changes in your um in
your
scope this is also something that must
be monitored and must be
uh you must create automatic alerts
to be able to act on it on time and
lastly like i mentioned
uh feedbacks from the users so
eventually uh
the users can give you feedbacks that
you cannot get from just by looking at
recall precision things that more relate
to the business and
this is i think this is a very important
part of how you measure a model
so closing the feedback loop always
needs to conclude
uh live feedback from from the model
and this is something we always
put in our models and i think is very
important
so last but not least
like ari mentioned
feel free to go to this website if you
want a t-shirt and
if you have any questions and you want
to ask so again feel free
thank you very much
i think i’m done
[Music]
if you have any questions please feel
free
quiet audience today
yeah i think ah we need to
[Music]
maybe you can write in the chat
what if someone wants to speak do they
have the ability to do it
someone is asking if you can show the
scan again
can you go back one slide
which one previously
this one and
[Music]
okay
thank you
you applied to the free deal yeah
so the jfrog has a feature
but you can okay cool already do you
want to
wrap it up do you have anything to add
or what
thank you
hello thank you for the
can you guys hear me yeah yes
uh thank you for presentation i hope
it’s helpful
uh do you there’s questions did you
answer all those
and yeah
beside the thank you thank you so
i guess you explain all these questions
yeah
[Music]
yeah there is a question from uh from
antoni
about the tool we use or the platform
for
producibility and history
okay yeah so it really depends on the
model so for the history it depends
where the model is
or the output of the model is deployed
for example
if we provide the score in salesforce
we define specific field and cell phones
to say to save
history and then they the apps can see
the history in salesforce itself
sometimes the models actually produce
the results in a dashboard so you can
just see the results on a dashboard and
everything is
saved in in the data data warehouse
in terms of repos reproducibility
our models are saved the notebooks are
saved in uh uh value high
in a specific configuration and this
gives us the ability to run the exact
same configuration
if we want to change our for example our
our target like like focus on recall
instead of precision or vice versa
that’s great yeah i just uh
antony i just answered before valor.com
okay what do you mean what are notebooks
saved in the notebooks are saved in in
at all
in a tool that we use it’s called
the execution itself is being saved in
in valencia
it’s great i guess this is all the
questions
yeah great appreciate your time
everyone’s time
um so hopefully we’re gonna see everyone
in next meeting and
also uh friend and meeting if you guys
wanna have another event in different
topics welcome
we welcome toast you again and the weird
participants
is really more than 90 percent of
continues in
like one hour it’s amazing so they
didn’t drop up
that means good great thank you
thank you everyone thank you all have a
good time bye