Track JFrog Platform Performance with Datadog Analytics

Faithful operation of your JFrog Platform can be best assured by tracking usage data of Artifactory and Xray. With insights gained through real-time observability and log analytics, you can boost the efficiency of your DevOps pipeline and keep your software releases running joyfully.
Datadog is a SaaS-based data analytics platform that is a popularly used monitoring service for cloud-scale applications. It’s a data analysis platform that can be readily enabled for JFrog Platform monitoring through our integrations.
Let’s take a look at the two-step process to install the data collector integration and use DataDog to monitor the operation of your JFrog Platform.
Using Fluentd
To start, we’ve made available a JFrog log analytics integration with the open-source data collector Fluentd that can be installed with each product instance of the JFrog Platform Deployment. Fluentd performs the log input, field extraction, and record transformation for each product in the JFrog Platform, normalizing the output of this data to JSON.
With all log data available in this common format, Fluentd will deliver it through Fluentd’s pluggable architecture to your Datadog dashboard.
Installing FluentD
You must install a Fluentd logging agent in each node of your JFrog Platform Deployment (JPD). This agent will tail the various JPD log files for new entries, apply any corresponding record transformations and then send to the relevant output plugin for Fluentd.
To install the Fluentd agent in each node, perform the procedure for the node’s OS type as shown in the Fluentd installation guide.
For example, for nodes operating Red Hat UBI Linux, the Fluentd agent td-agent must be installed. For root-based package managers (root access is required):
$ curl -L https://toolbelt.treasuredata.com/sh/install-redhat-td-agent3.sh | sh
Or, for user-space installations on Red Hat UBI, to install the Fluentd Ruby and Gem:
$ curl -O | tar -xvf
Configuring FluentD
Depending upon if we just completed a root based or non-root based installation the Fluentd configuration file may need to be placed in different locations.
By default for package manager root installations the td-agent.conf file is located in /etc/td-agent/.
$ ls -al /etc/td-agent/td-agent.conf
-rw-r--r-- 1 root root 8017 May 11 18:09 /etc/td-agent/td-agent.conf
For non-root based installations we can store the td-agent.conf file anywhere we have write permissions. When we run the td-agent, we can use the -c flag to point Fluentd to this file location.
The configuration file must be replaced with a configuration file derived from the JFrog log analytics Github repo.
In this repo, the elastic folder contains configuration file templates. Use the template that matches the JFrog application running in the node.
- Artifactory 7.x
- Xray 3.x
- Artifactory 6.x
We will need to update this configuration file with a match directive that specifies the host and port that points to our Datadog instance.
#DATADOG OUTPUT

  @type Datadog
  @id Datadog_agent_Artifactory
  api_key
  # optional
  include_tag_key true
  dd_source Fluentd

#END DATADOG OUTPUT
Running Fluentd
Now that we have the new configuration file in place we can start td-agent as a service on the pod after logging into the container:
$ systemctl start td-agent
For non-root installs, we can run the td-agent against the configuration file directly:
$ td-agent -c td-agent.conf
This will start the Fluentd logging agent which will tail the JPD logs and send them all over to Elasticsearch.
You must repeat these procedures for all Kubernetes pods running Artifactory and Xray.
Using Datadog
Datadog can be set up by creating an account and going through onboarding steps or by using apiKey if one already exists. If it is a new Datadog setup, do the following:
- Run the Datadog agent in your Kubernetes cluster by deploying it with a Helm chart
- To enable log collection, update
Datadog-values.yamlgiven in the onboarding steps - Once the agent starts reporting, you’ll get an apiKey which we’ll be using to send formatted logs through Fluentd
- Install Fluentd integration by going to Integrations, search for Fluentd and install it
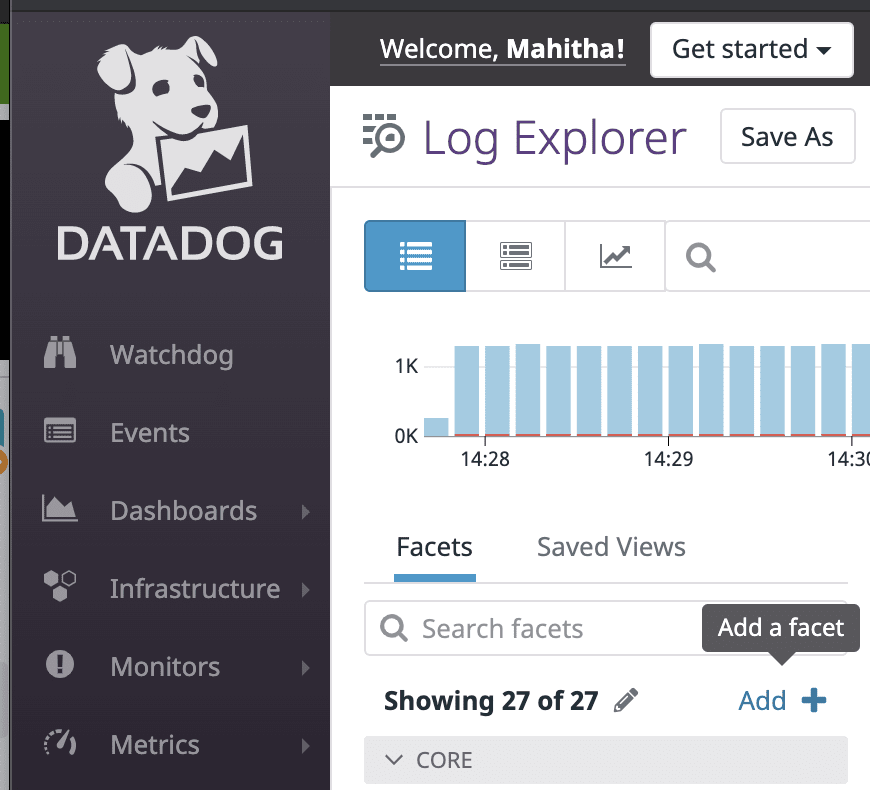
Once the Datadog is set up, we can access logs through Logs > Search. We can also select the specific source that we want logs from.
If an apiKey exists, use the Datadog Fluentd plugin to forward logs directly from Fluentd to your Datadog account. Follow the Fluentd plugin configuration instructions for Artifactory to set up your integration. Adding proper metadata is the key to unlocking the full potential of your logs in Datadog. By default, the hostname and timestamp fields should be remapped so we don’t specify them.
Add all attributes as Facets from Facets > Add on the left side of the screen in Logs > Search
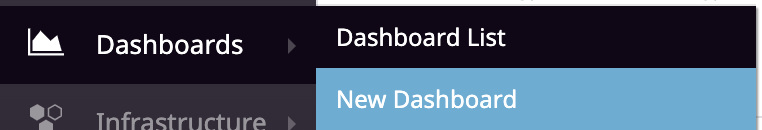
Now create a new dashboard from Dashboards > New Dashboard > New screenboard
Import the dashboard from export.json and replace the existing new dashboard with it. You can now access the dashboard which contains information displayed through our data widgets to give real time observability into JFrog Unified Platform.
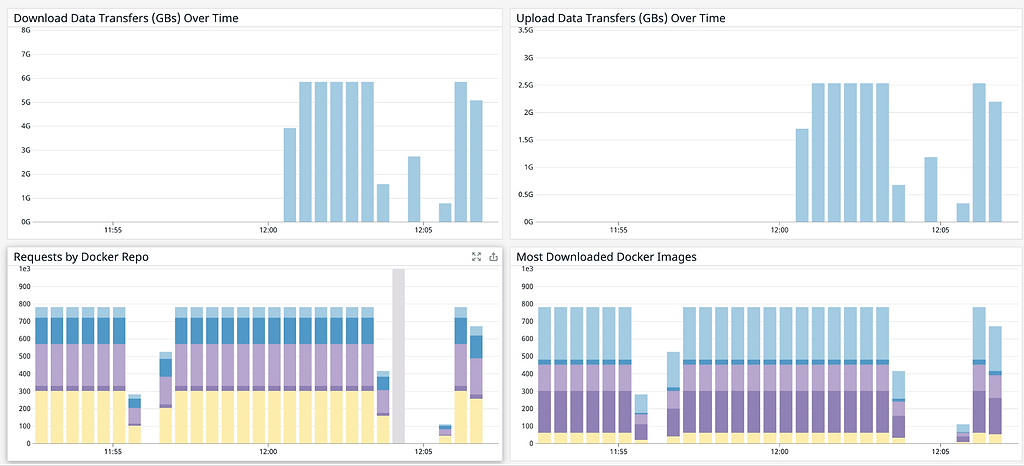
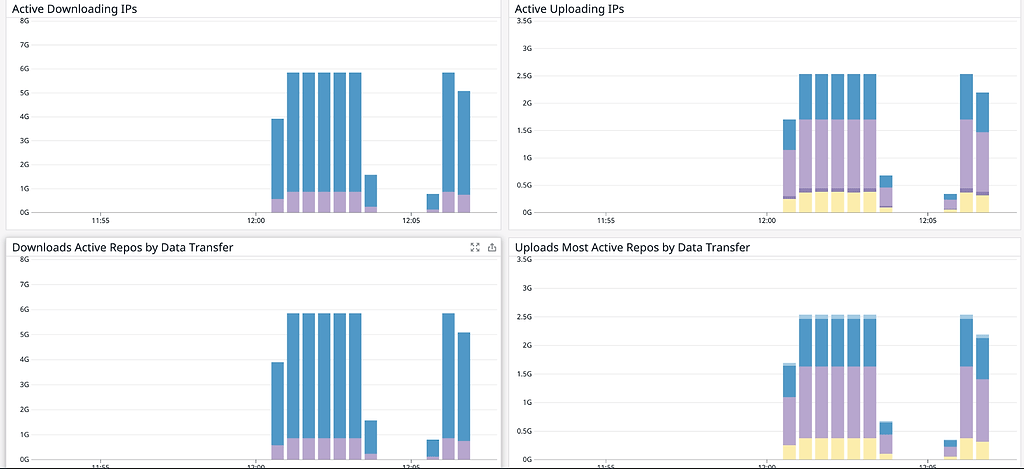
Once installed, The JFrog Platform Logs dashboard presents timeline and count data for key operating metrics:
- Log volumes, which can be filtered by type
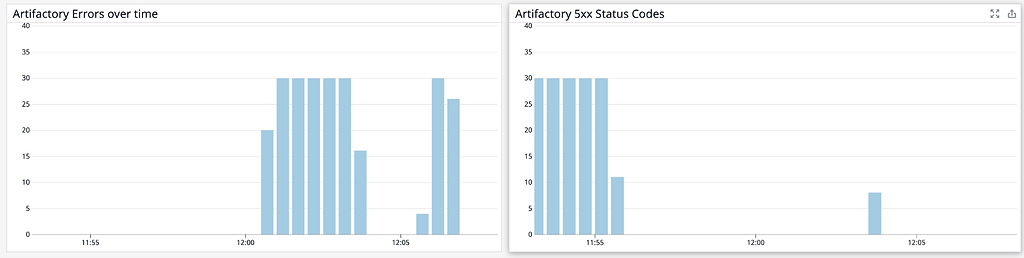
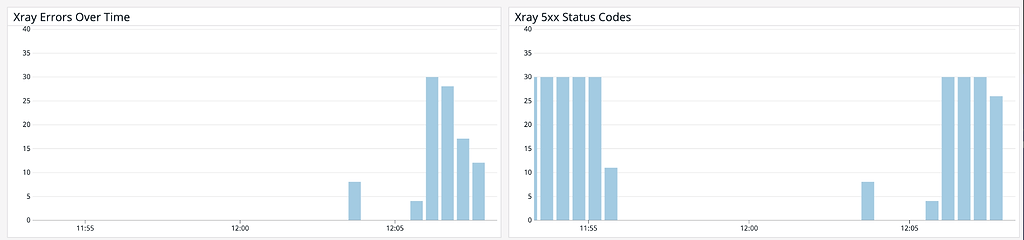
- Service errors
- HTTP response codes
- Accessed image
- Accessed repositories
- Data transfers in GB for uploads/downloads
- Top 10 IPs for upload/download
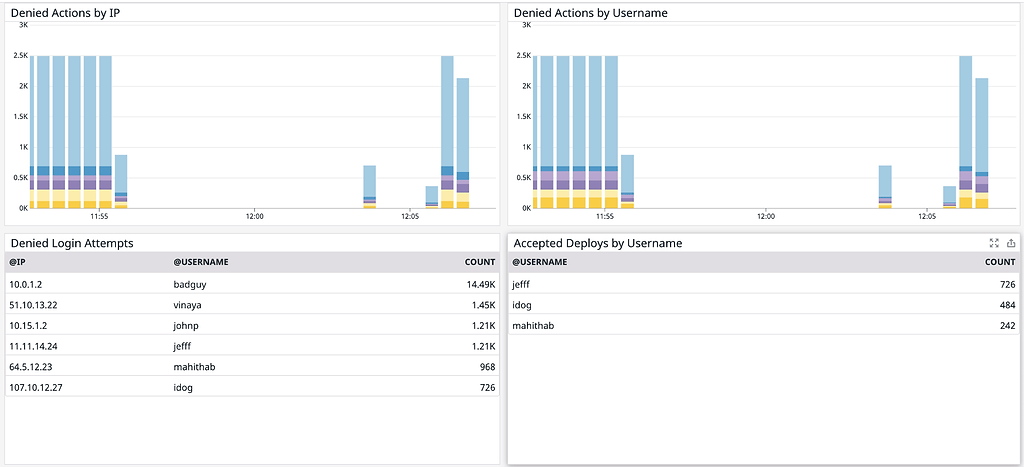
- Audit actions by username
- Denied actions and logins by IP and username
- Accepted deploys by username
A Fetching Solution
Now you have a robust tracking solution using Datadog, and are empowered to monitor your JFrog Platform Deployment across all of its services and executing nodes, gaining valuable data insights into its operation.


