JFrog Announces Fourth Quarter and Fiscal 2022 Results
PRESS RELEASE, 2023年 2月 8日
Sunnyvale, Calif., February 8, 2023 — JFrog Ltd. (“JFrog”) (Nasdaq: FROG), the Liquid Software company and creators of the JFrog Software Supply Chain Platform, today announced financial results for its fourth quarter and fiscal year ended December 31, 2022.
“Our fourth quarter revenue results were in line with the guidance range we provided, and we met our commitments on profitability, despite macroeconomic headwinds increasing near the end of the year,” said Shlomi Ben Haim, JFrog Co-founder and CEO. “We are excited to see the continued expansion in the adoption of the JFrog Software Supply Chain Platform, as customers continue to favor a single, universal platform to manage their DevOps and DevSecOps processes. The release of JFrog Advanced Security saw rapid adoption by both new and existing customers looking to incorporate the comprehensive set of capabilities and consolidate current security point solutions. As we enter 2023, we expect our investments in binary management, security and cloud – all in one platform – to bear fruit and fuel our growth.”
Fourth Quarter Financial Highlights
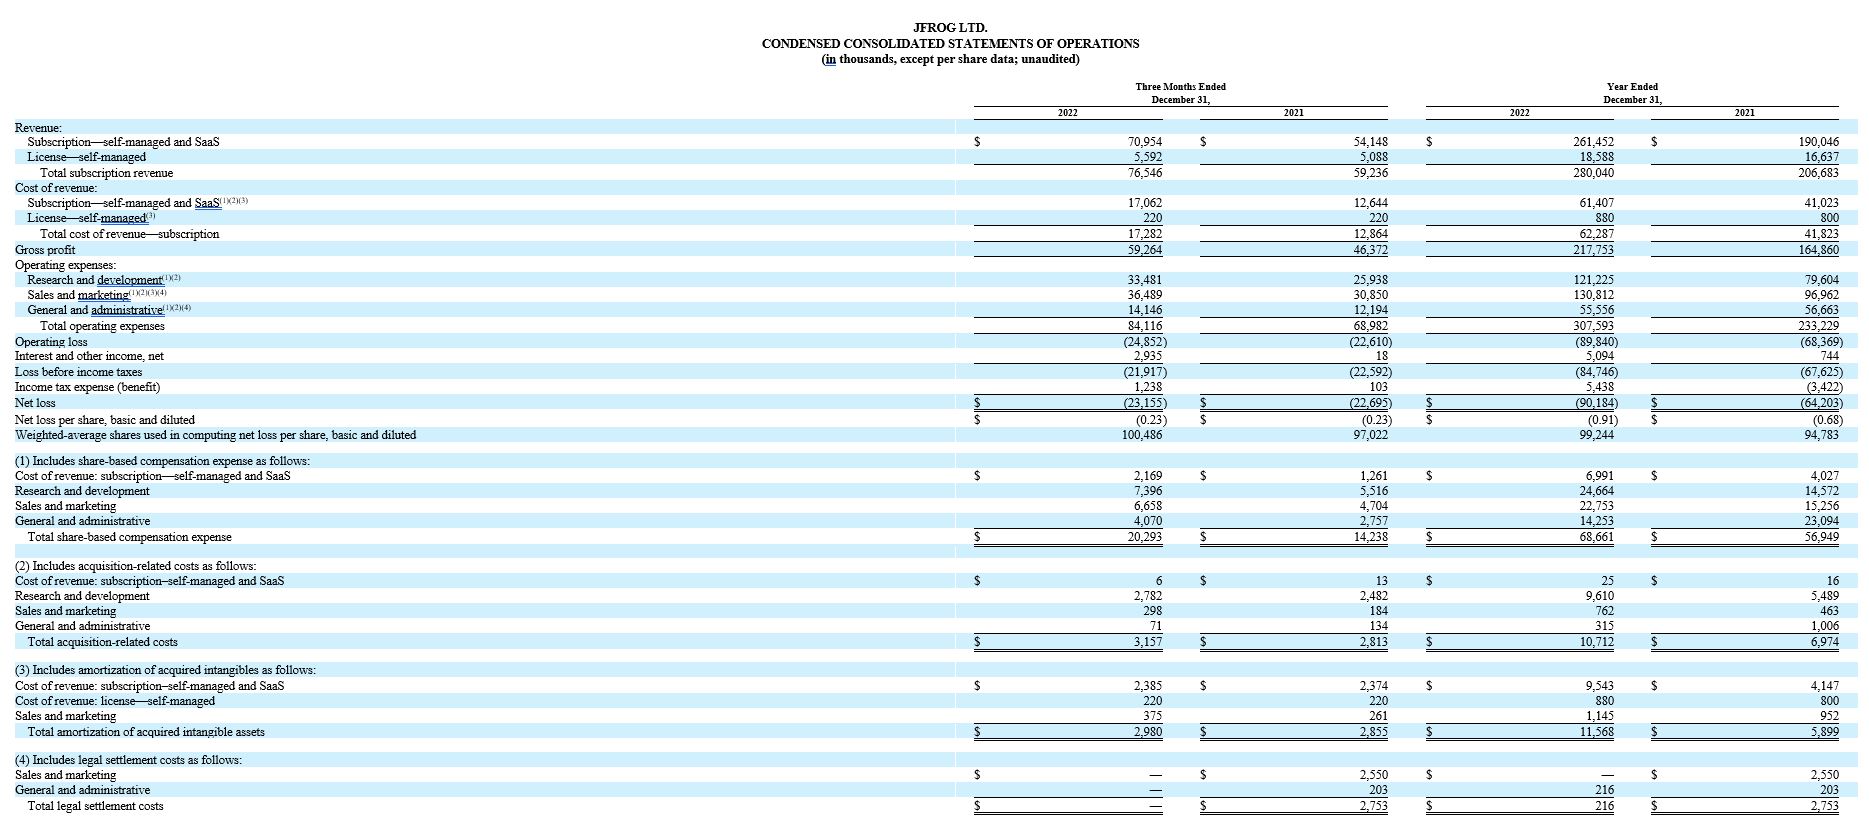
● Revenue equaled $76.5 million, an increase of 29% year-over-year.
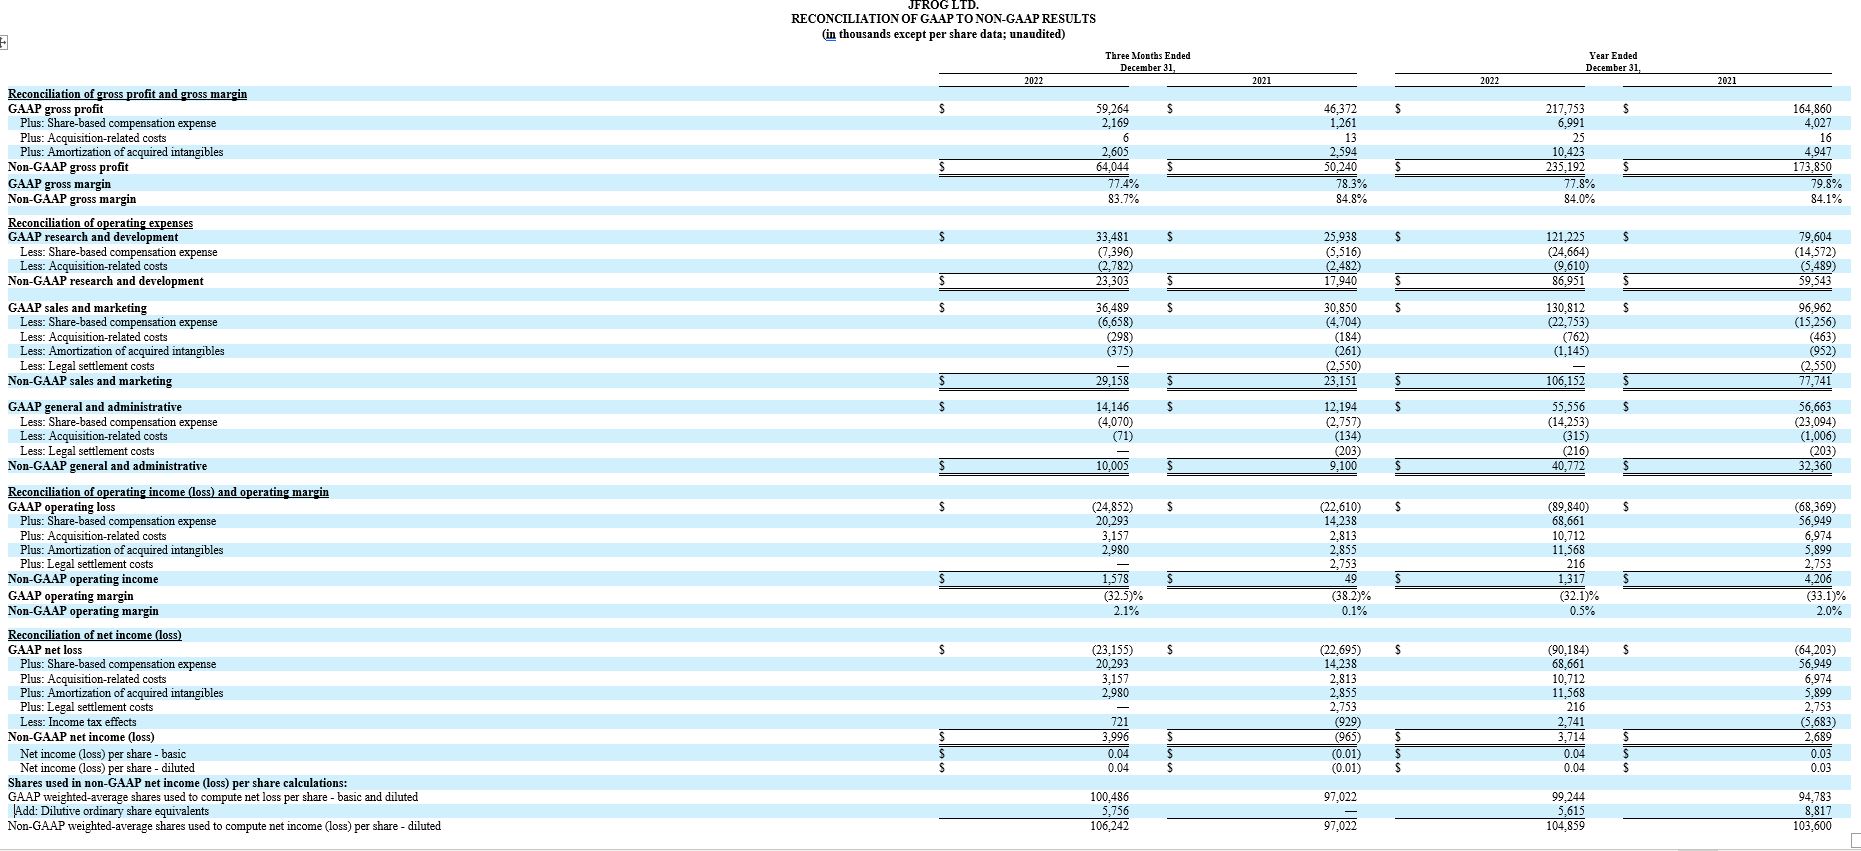
● GAAP Gross Profit was $59.3 million; GAAP Gross Margin was 77.4%.
● Non-GAAP Gross Profit was $64.0 million; Non-GAAP Gross Margin was 83.7%.
● GAAP Operating Loss was ($24.9) million; GAAP Operating Margin was (32.5%).
● Non-GAAP Operating Profit was $1.6 million; Non-GAAP Operating Margin was 2.1%.
● GAAP Net Loss Per Share was ($0.23); Non-GAAP Earnings Per Share was $0.04.
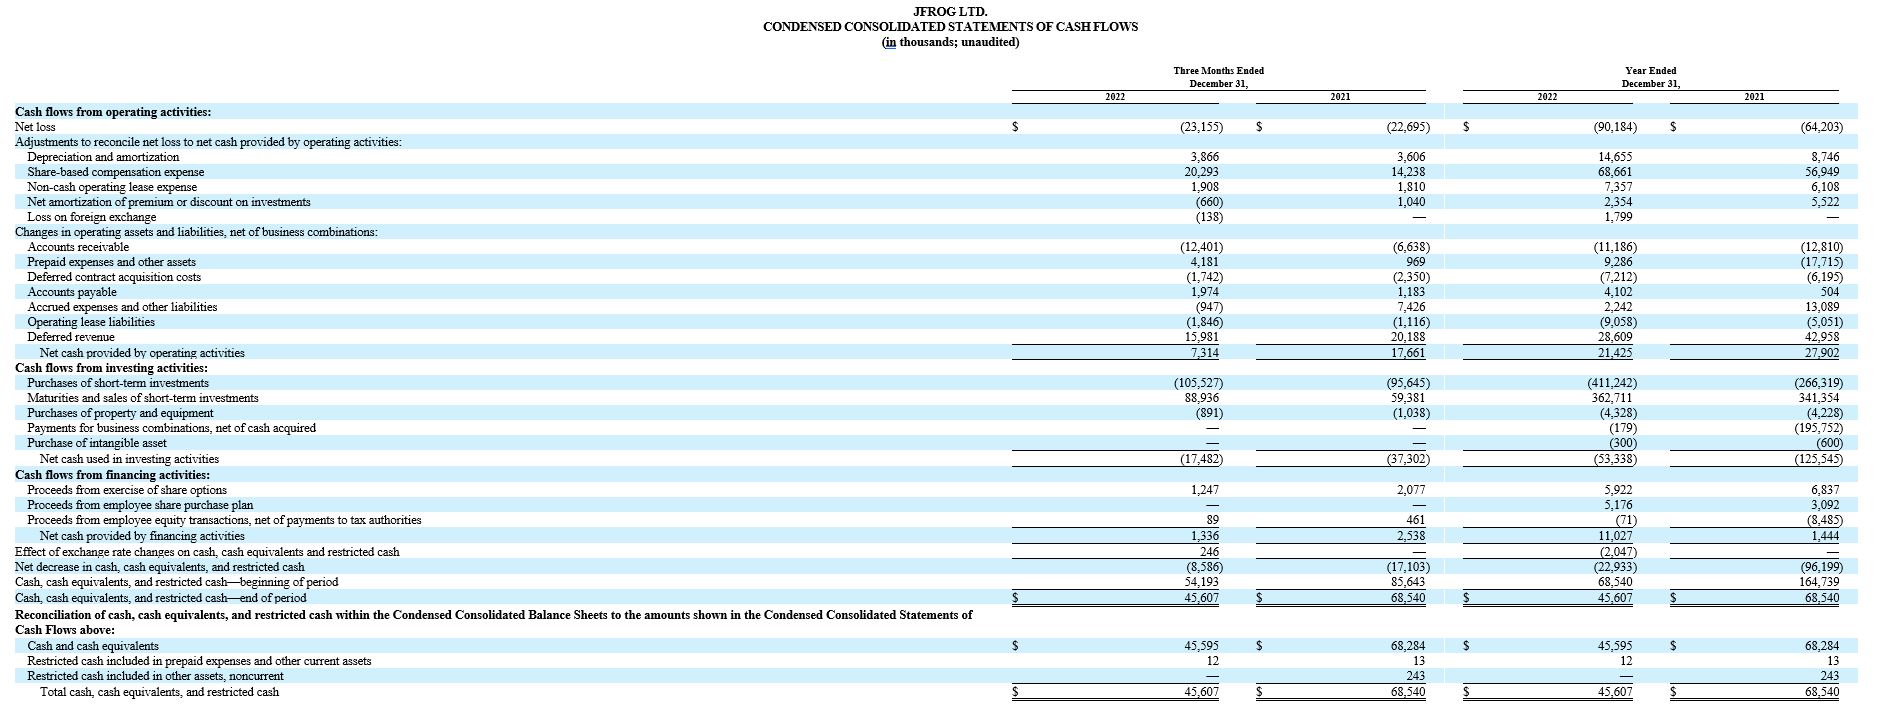
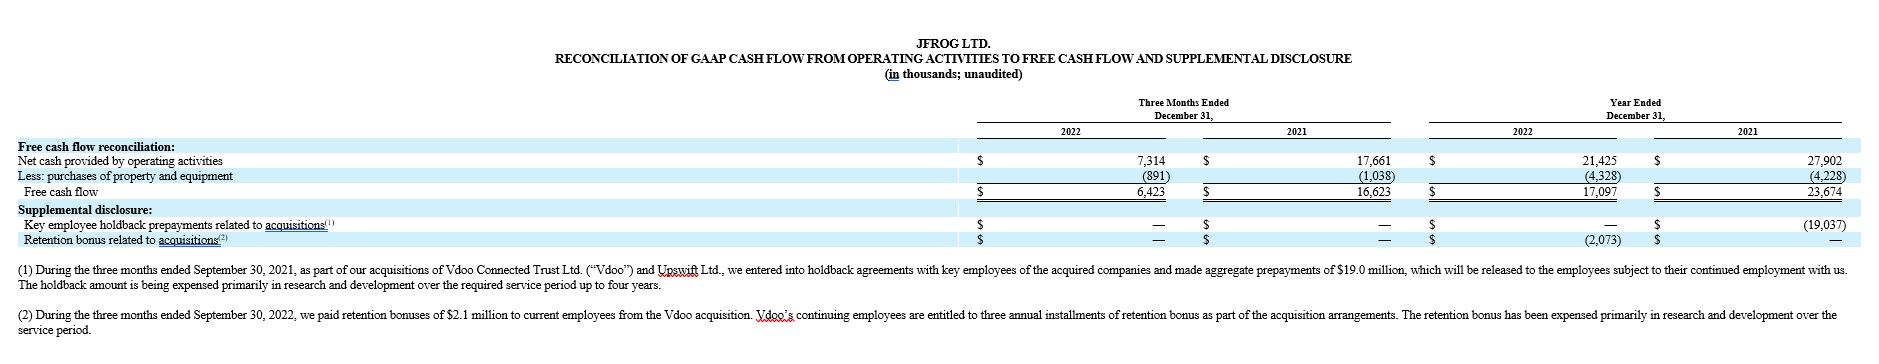
● Operating Cash Flow was $7.3 million, with Free Cash Flow of $6.4 million.
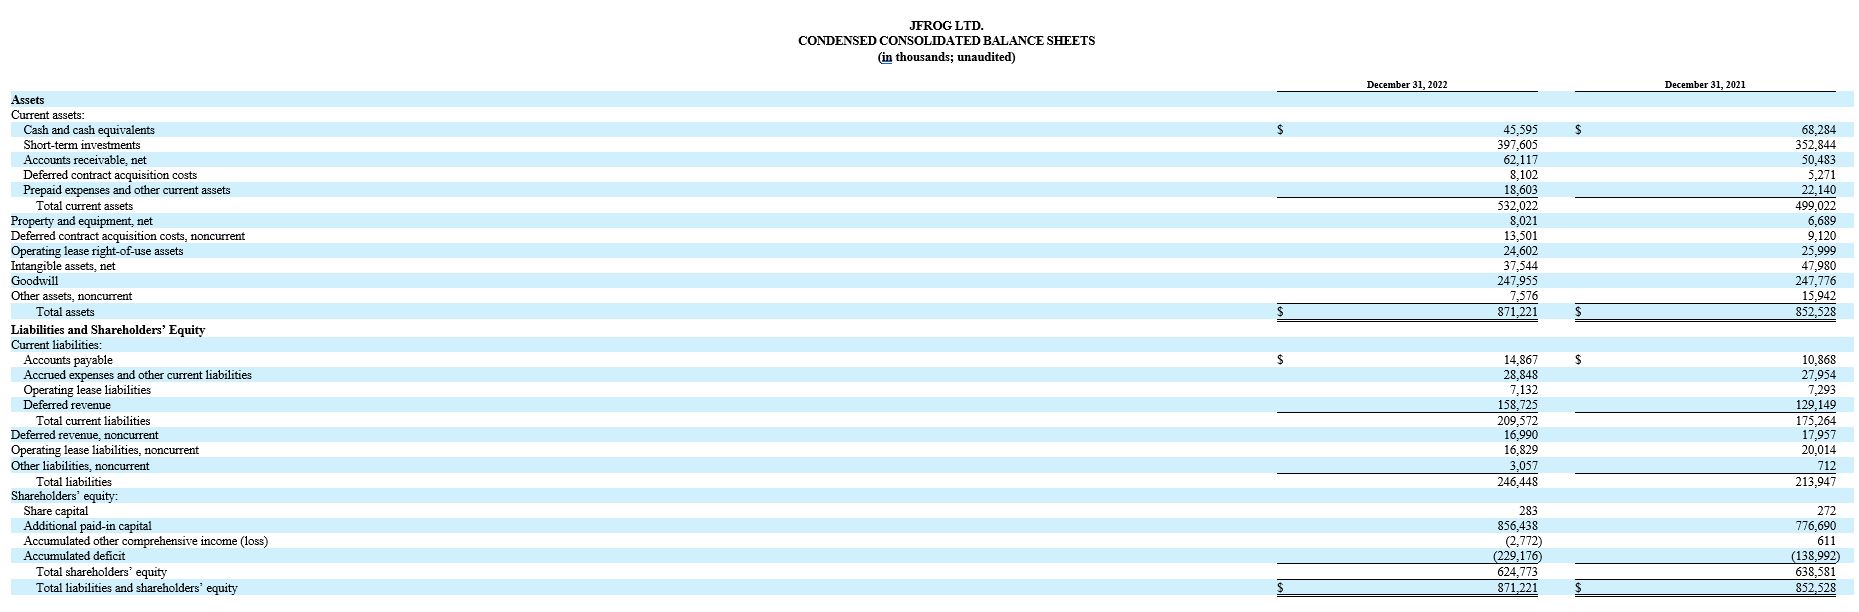
● Cash, Cash Equivalents and Investments were $443.2 million as of December 31, 2022.
● Remaining performance obligations were $204.7 million as of December 31, 2022.
Fiscal Year 2022 Financial Highlights
● Revenue equaled $280.0 million, an increase of 35% year-over-year.
● GAAP Gross Profit was $217.8 million; GAAP Gross Margin was 77.8%.
● Non-GAAP Gross Profit was $235.2 million; Non-GAAP Gross Margin was 84.0%.
● GAAP Operating Loss was ($89.8) million; GAAP Operating Margin was (32.1%).
● Non-GAAP Operating Profit was $1.3 million; Non-GAAP Operating Margin was 0.5%.
● GAAP Net Loss Per Share was ($0.91); Non-GAAP Earnings Per Share was $0.04.
● Operating Cash Flow was $21.4 million, with Free Cash Flow of $17.1 million.
● 7,200 customers, compared to 6,650 in the year ago period; growth of 8% year-over-year.
Q4 Recent Business & Product Highlights
● Software Supply Chain Platform adoption
▪ Customers adopting the complete JFrog Platform represented 43% of total revenue compared to 35% in the year ago period.
▪ $100K ARR customers increased 37% year-over-year to 736 customers, compared to 537 in the year ago period.
● JFrog Advanced Security release – recorded multiple design wins for JFrog Advanced Security. Best-of-breed security approach combined with an integrated, hybrid platform addresses market needs.
● Customer expansion
▪ Net Dollar Retention rate for the trailing four quarters was 128%.
▪ $1 million ARR customers increased 27% year-over-year to 19 customers, up from 15 customers as of December 31, 2021.
● Cloud & multi-cloud
▪ Revenue equaled $22.6 million during the fourth quarter of 2022, an increase of 53% over the year ago period, and $80 million for fiscal 2022, up 60% year-over-year.
▪ Cloud revenue represented 30% of total fourth quarter revenue, compared to 25% in the year ago period.
First Quarter and Fiscal Year 2023 Outlook
● First Quarter 2023 Outlook:
▪ Revenue between $78 million and $79 million.
▪ Non-GAAP operating income between $1.5 million and $2.5 million.
▪ Non-GAAP net income per diluted share between $0.03 and $0.05, assuming approximately 107 million weighted average diluted shares outstanding.
● Fiscal Year 2023 Outlook:
▪ Revenue between $340 million to $344 million.
▪ Non-GAAP operating income between $17 million and $19 million.
▪ Non-GAAP net income per diluted share between $0.18 and $0.20 assuming approximately 110 million weighted average diluted shares outstanding.
The section titled “Non-GAAP Financial Information” below describes our usage of non-GAAP financial measures. Reconciliations between historical GAAP and non-GAAP information are contained at the end of this press release following the accompanying financial data.
Conference Call Details
● Event: JFrog’s Fourth Quarter and Fiscal 2022 Financial Results Conference Call
● Date: Wednesday, February 8th, 2023
● Time: 2:00 p.m. PT (5:00 p.m. ET)
A live webcast of the conference call will be accessible from the investor relations website at https://investors.jfrog.com/events-and-presentations.
About JFrog
JFrog Ltd. (Nasdaq: FROG), is on a mission to power all the world’s software updates, driven by a
“Liquid Software” vision to allow the seamless, secure, fearless flow of binaries from developers
to the edge. The JFrog Software Supply Chain Platform enables software creators to power their entire software supply chain throughout the full binary lifecycle, so they can build, secure, distribute, and connect any source with any production environment. JFrog’s hybrid, universal, multi-cloud platform is available as both self-hosted and SaaS services across major cloud service providers. Millions of users and thousands of customers worldwide, including a majority of the Fortune 100, depend on JFrog solutions to securely embrace digital transformation. Once you leap forward, you won’t go back! Learn more at jfrog.com and follow us on Twitter: @JFrog.
Forward-Looking Statements:
This press release and the earnings call referencing this press release contain “forward-looking”
statements, as that term is defined under the U.S. federal securities laws, including but not limited to statements regarding JFrog’s future financial performance, including our outlook for the first quarter and for the full year of 2023, our leadership position in the markets in which we participate, our ability to drive growth, our expectations regarding the market and revenue potential for JFrog.
JFrog Artifactory, JFrog Xray, JFrog Distribution, JFrog Connect, and JFrog Advanced Security for DevSecOps, including the efficacy and benefit of integrating of any of the foregoing with other products and platforms, the growth potential of our cloud business, including hybrid and multi-cloud, our ability to provide effective tools and solutions to detect and remediate security vulnerabilities, the ability of our strategic sales team to grow the business across top-tier accounts, our ability to expand usage of our platform in the government and commercial sectors, our ability to successfully integrate acquisitions into our business operations, including the software supply chain platform, and realize anticipated benefits and synergies from such acquisitions, our ability to contribute data to global security standards bodies, and our ability to innovate and meet market demands and the software supply chain needs of our customers. These forward-looking statements are based on JFrog’s current assumptions, expectations and beliefs and are subject to substantial risks, uncertainties, assumptions and changes in circumstances that may cause JFrog’s actual results, performance or achievements to differ materially from those expressed or implied in any forward-looking statement.
There are a significant number of factors that could cause actual results to differ materially from statements made in this press release and our earnings call, including but not limited to: risks associated with managing our rapid growth; our history of losses; our limited operating history; our ability to retain and upgrade existing customers our ability to attract new customers; our ability to effectively develop and expand our sales and marketing capabilities; our ability to integrate and realize anticipated synergies from acquisitions of complementary businesses; risk of a security breach incident or product vulnerability; risk of interruptions or performance problems associated with our products and platform capabilities; our ability to adapt and respond to rapidly changing technology or customer needs; our ability to compete in the markets in which we participate; our ability to successfully integrate technology from recent acquisitions, into our offerings; our ability to provide continuity to our respective customers following our acquisitions, and our ability to realize innovations following the acquisition; general market, political, economic, and business conditions; and the duration and impact of the COVID-19 pandemic. Our actual results could differ materially from those stated or implied in forward-looking statements due to a number of factors, including but not limited to, risks detailed in our filings with the Securities and Exchange Commission, including in our annual report on Form 10-K our quarterly reports on Form 10-Q, and other filings and reports that we may file from time to time with the Securities and Exchange Commission. Forward-looking statements represent our beliefs and assumptions only as of the date of this press release. We disclaim any obligation to update forward-looking statements.
About Non-GAAP Financial Measures:
JFrog discloses the following non-GAAP financial measures in this release and the earnings call
referencing this press release: non-GAAP operating income (loss), non-GAAP gross profit, non-
GAAP gross margin, non-GAAP operating expenses (research and development, sales and
marketing, general and administrative), non-GAAP operating margin, non-GAAP net income (loss), non-GAAP net income (loss) per diluted share, non-GAAP net income (loss) per basic share, and free cash flow. JFrog uses each of these non-GAAP financial measures internally to understand and compare operating results across accounting periods, for internal budgeting and forecasting purposes, for short- and long-term operating plans, and to evaluate JFrog’s financial performance. JFrog believes they are useful to investors, as a supplement to GAAP measures, in evaluating its operational performance, as further discussed below. JFrog’s non-GAAP financial measures may not provide information that is directly comparable to that provided by other companies in its industry, as other companies in its industry may calculate non-GAAP financial results differently, particularly related to non-recurring and unusual items. In addition, there are limitations in using non-GAAP financial measures because the non-GAAP financial measures are not prepared in accordance with GAAP and may be different from non-GAAP financial measures used by other companies and exclude expenses that may have a material impact on JFrog’s reported financial results.
Non-GAAP financial measures should not be considered in isolation from, or as a substitute for,
financial information prepared in accordance with GAAP. A reconciliation of the historical non-
GAAP financial measures to their most directly comparable GAAP measures has been provided in the financial statement tables included below in this press release. A reconciliation of non-GAAP guidance measures to corresponding GAAP measures is not available on a forward-looking basis without unreasonable effort due to the uncertainty regarding, and the potential variability of, reconciling items that may be incurred in the future such as share-based compensation, the effect of which may be significant.
JFrog defines non-GAAP gross profit, non-GAAP operating expenses (research and development, sales and marketing, general and administrative), non-GAAP gross margin, non-GAAP operating margin, non-GAAP operating income (loss) and non-GAAP net income (loss) as the respective GAAP balances, adjusted for, as applicable: (1) share-based compensation expense; (2) the amortization of acquired intangibles; (3) acquisition-related costs; (4) legal settlement costs and (5) income tax effects. JFrog defines free cash flow as Net cash provided by (used in) operating activities, minus capital expenditures. Investors are encouraged to review the reconciliation of these historical non-GAAP financial measures to their most directly comparable GAAP financial measures.
Management believes these non-GAAP financial measures are useful to investors and others in
assessing JFrog’s operating performance due to the following factors:
Share-based compensation. JFrog utilizes share-based compensation to attract and retain
employees. It is principally aimed at aligning their interests with those of its shareholders and at
long-term retention, rather than to address operational performance for any particular period. As a result, share-based compensation expenses vary for reasons that are generally unrelated to financial and operational performance in any particular period.
Amortization of acquired intangibles. JFrog views amortization of acquired intangible assets as items arising from pre-acquisition activities determined at the time of an acquisition. While these intangible assets are evaluated for impairment regularly, amortization of the cost of acquired intangibles is an expense that is not typically affected by operations during any particular period.
Acquisition-related costs. Acquisition-related costs include expenses related to acquisitions of other companies. JFrog views acquisition-related costs as expenses that are not necessarily reflective of operational performance during a period.
Legal settlement costs. From time-to-time JFrog incurs charges related to litigation settlements. We exclude these charges and related professional service costs when associated with a significant settlement because they are not reflective of JFrog’s ongoing business and operating results.
Income tax effects. JFrog’s non-GAAP financial results are adjusted for income tax effects related to these non-GAAP adjustments and changes in our assessment regarding the realizability of our deferred tax assets, if any. Excluding income tax effects of non-GAAP adjustments provides a more accurate view of JFrog’s operating results.
Non-GAAP weighted average share count. Diluted GAAP and non-GAAP weighted-average shares are the same, except in periods that there is a GAAP loss and a non-GAAP income. The non-GAAP weighted-average shares used to compute the non-GAAP net income per share – diluted are adjusted to reflect dilution equal to the dilutive impact had there been GAAP income.
Additionally, JFrog’s management believes that the non-GAAP financial measure, free cash flow, is meaningful to investors because management reviews cash flows generated from operations
after taking into consideration capital expenditures due to the fact that these expenditures are
considered to be a necessary component of ongoing operations.
Operating Metrics
JFrog’s number of customers with annual recurring revenue (“ARR”) of $100,000 or more is based on the ARR of each customer, as of the last month of the quarter. JFrog’s number of customers with ARR of $1 million or more is based on the ARR of each customer, as of the last month of the quarter. JFrog defines ARR as the annualized revenue run-rate of subscription agreements from all customers as of the last month of the quarter. The ARR includes monthly subscription customers, so long as JFrog generates revenue from these customers. JFrog annualizes its monthly subscriptions by taking the revenue it would contractually expect to receive from such customers in a given month and multiplying it by 12.
JFrog’s net dollar retention rate compares its ARR from the same set of customers across
comparable periods. JFrog calculates net dollar retention rate by first identifying customers (the
“Base Customers”), which were customers in the last month of a particular quarter (the “Base
Quarter”). JFrog then calculates the contracted ARR from these Base Customers in the last month of the same quarter of the subsequent year (the “Comparison Quarter”). This calculation captures upsells, contraction, and attrition since the Base Quarter. JFrog then divides total Comparison Quarter ARR by total Base Quarter ARR for Base Customers. JFrog’s net dollar retention rate in a particular quarter is obtained by averaging the result from that particular quarter with the corresponding results from each of the prior three quarters.
Investor Contact:
Jeff Schreiner
jeffs@jfrog.com