Log Analytics
JFrog Artifactory’s logs hold a wealth of critical data. From information on server activity, to access information, site traffic, upload and download file sizes and much more. While the information is all there, our ability to analyze it in its raw form is very limited. While we may be able to spot a particular event that happened at some specific given time, it’s virtually impossible to see trends, or transient spikes in activity unless someone points them out. Log analytics does just that.
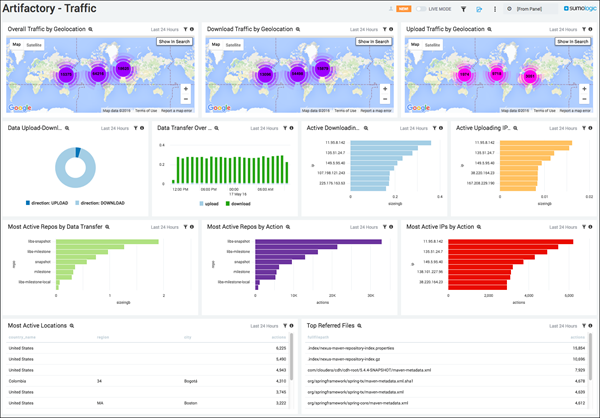
JFrog and Sumo Logic have partnered to create the Sumo Logic App for Artifactory. Out-of-the-box, with virtually one click, you can create an account on Sumo Logic (or connect up to your existing account) and start populating it with data from your Artifactory logs. Within minutes you have pre-configured dashboards with graphs that show:
- Overall traffic to your Artifactory instance segmented by geolocation, IP, repositories etc.
- Deployments by geolocation, IP, repositories etc.
- Request and access data – requests by repository and other parameters, status codes, access denials etc.
- Downloads by geolocation, IP, repositories and other parameters
These log analytics give a detailed view of the activities around your Artifactory instances and their repositories and provide actionable insights into steps you can take to optimize the workflow around your binary assets.