Graphs
Mission Control stores historical data about Artifactory instances and their repositories. Together with real time data, this information can provide insights on how you need to manage those instances. Storage Graphs can help you determine when and where you need to make changes in how storage is allocated among the different Artifactory instances and their repositories.
Top 5 Instances (Historical) shows the 5 instances that used the largest amount of storage over any historical time period, and allow you to zoom in from monthly down to hourly intervals. If any of these instances show a steady increase in storage used, you can figure out when storage will become scarce and plan to increase it or perform cleanup accordingly.
Top 5 Repositories (Historical) shows the 5 repositories whose maximal storage used over the selected time period is greatest for a selected Artifactory instance. This graph allows you to zoom in on any particular instance and investigate any peaks in storage consumption to see if additional storage should be allocated, or perhaps the team should use separate repositories for different phases in the development cycle.
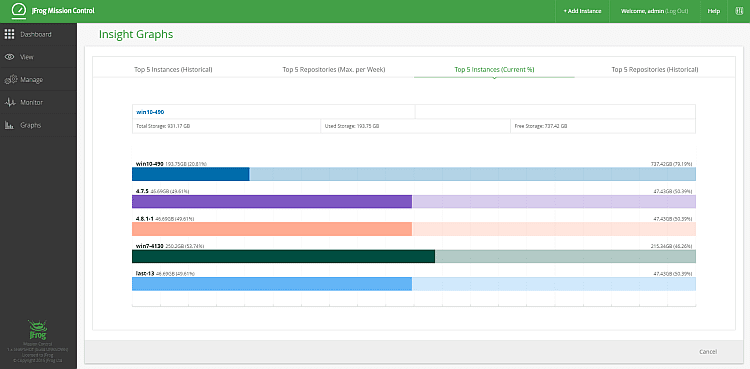
Top 5 Instances (Current %) shows the five instances that are currently using the highest percentage of their available storage. You can select any bar to view details, and if any instance reaches the set threshold, the bar is displayed in red as a warning to indicate you should investigate further.
Top 5 Repositories (Max. per Week) – shows the five repositories whose maximum usage of storage has been highest on a weekly basis for the selected instance. Since the graph displays peak storage, it may indicate bursts of excessive activity that should be investigated.