Customizing the JFrog Xray Horizontal Pod Autoscaler
In cloud native computing (Kubernetes in our case), there is a requirement to automatically scale the compute resources used for performing a task. The autoscaling cloud computer strategy allows to dynamically adjust the active number of application servers and allocated resources instead of responding manually in real-time to traffic surges that necessitate more resources and instances.
The Helm chart used to install JFrog Xray makes use of a Horizontal Pod Autoscaler (HPA) which is based on CPU utilization. This means that if the CPU usage of the Xray application exceeds a specified threshold, the HPA will spin up extra pods to assist and distribute the load more equally. When the aggregate CPU consumption falls below a certain threshold, the HPA will reduce the number of pods correspondingly.
However, this autoscaling approach has two major drawbacks:
- Autoscaling happens only when CPU consumption reaches or exceeds a given threshold, which is less efficient compared to a more proactive strategy of anticipating a prospective resource increase and scaling up ahead of time, potentially shortening the Xray scanning duration as more computational power is already available.
- Some application features, such as the Xray DB Synchronization, are single-threaded and cannot benefit from additional application nodes in the cluster. Should these features cause a rise in CPU usage, an unnecessary scaleup would occur, resulting in an increase of expenses that could have been avoided.
To improve this, we can customize autoscaling to scale based on specific application metrics rather than general resource utilization.
This blog post will describe how you can use an advanced method of implementing a custom metrics HPA to improve how JFrog Xray scales in Kubernetes.
Using Custom Metrics
JFrog Xray features an OpenMetrics API that contains, among other metrics, the size of Xray RabbitMQ queues. When evaluated correctly, queue sizes can be directly related to current and potential resource utilization. This implies that if we autoscale based on certain queues (Indexer, Persist & Analysis), we may anticipate a future rise in resource demand and scale the pods up ahead of time. To avoid unnecessary scaling, we will not perform autoscaling on any metrics or queues that cannot benefit from a scale up.
Kubernetes supports custom metrics scaling for HPA, which means that we should find a strategy for the HPA to access the Xray API endpoint and utilize the metrics it provides.
Developing The Solution
The default Kubernetes Metrics Server cannot directly connect to HTTP endpoints such as the Xray API to retrieve data, implying that another component will be necessary to fetch the data from Xray and allow the HPA to access it. Instead of developing a whole new metrics server, we can see that there are existing adapters that can act as metrics servers and link custom applications and HPAs.
One of those adapters, called ‘prometheus-adapter’ can be used to enable HPAs to autoscale depending on metrics stored on pre-existing Prometheus instances.
Here’s the architecture:
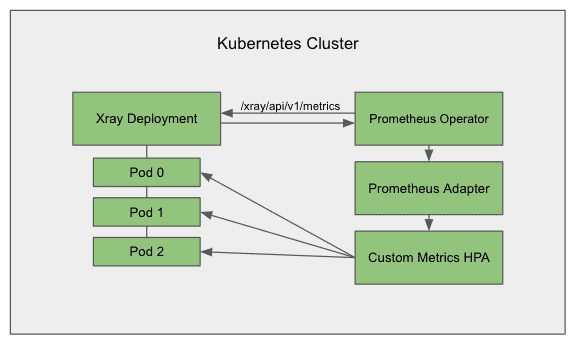
First, we’ll deploy ‘kube-prometheus-stack’ to the K8s cluster and configure it with a scrape job that sends an authenticated request to Xray via ‘/xray/api/v1/metrics’ at regular 1 second intervals and stores the metrics locally:
prometheus:
  prometheusSpec:
    serviceMonitorSelectorNilUsesHelmValues: false
    additionalScrapeConfigs:
      - job_name: 'xray-metrics'
        metrics_path: '/xray/api/v1/metrics'
        scrape_interval: 1s
        honor_labels: true
        static_configs:
          - targets: ['xray:8082']
            labels:
              pod: 'xray-0'
        authorization:
          credentials: ""
Following that, we’ll deploy and configure ‘prometheus-adapter’, and confirm that it can pull metrics from the Prometheus operator:
prometheus:
  url: http://prometheus-operator-kube-p-prometheus
rules:
  default: false
  custom:
  - seriesQuery: 'queue_messages_total{queue_name="index"}'
    resources: { template: "<<.Resource>>" }
    name:
      matches: "^(.*)"
      as: "index" # the metric name which HPA will use
    metricsQuery: 'queue_messages_total{queue_name="index"}' # the query is sent to prometheus-operator > http://localhost:9090/api/v1/query?query=
# query prometheus-adapter to check if it picks up metrics from Prometheus
$ kubectl get --raw="/apis/custom.metrics.k8s.io/v1beta1/namespaces/project/pods/*/indexFinally, we’ll construct an HPA and set it up to scale based on the metrics hosted by the adapter:
spec:
  scaleTargetRef:
    apiVersion: apps/v1
    kind: StatefulSet
    name: xray
  minReplicas: 1
  maxReplicas: 10
  metrics:
  - type: Pods
    pods:
      metric:
        name: index
      target:
        type: AverageValue
        averageValue: "100"
Conclusion
Based on the average value of 100 messages in the RabbitMQ Index queue, the HPA above autoscales the Xray pods from 1 to 10. This means that Xray will have one pod if the message queue is under 100, five pods if the queue is over 500, and so on.
Using this customized configuration, the new HPA recognizes incoming Xray traffic following the size increase of select RabbitMQ queues and scales up the nodes early in preparation for the upcoming workload. This reduces the time it takes Xray to scan artifacts when compared to the existing CPU-based HPA.
In addition, while the existing CPU-based HPA would have scaled up to 4 additional pods after a DB sync, the new metrics HPA does not perform any autoscaling following DB syncs or similar single-threaded operations. This means that no further expenses will be incurred due to unnecessary increase in computational power.


